Global Gender Gap Report 2025


Benchmarking gender gaps, 2025
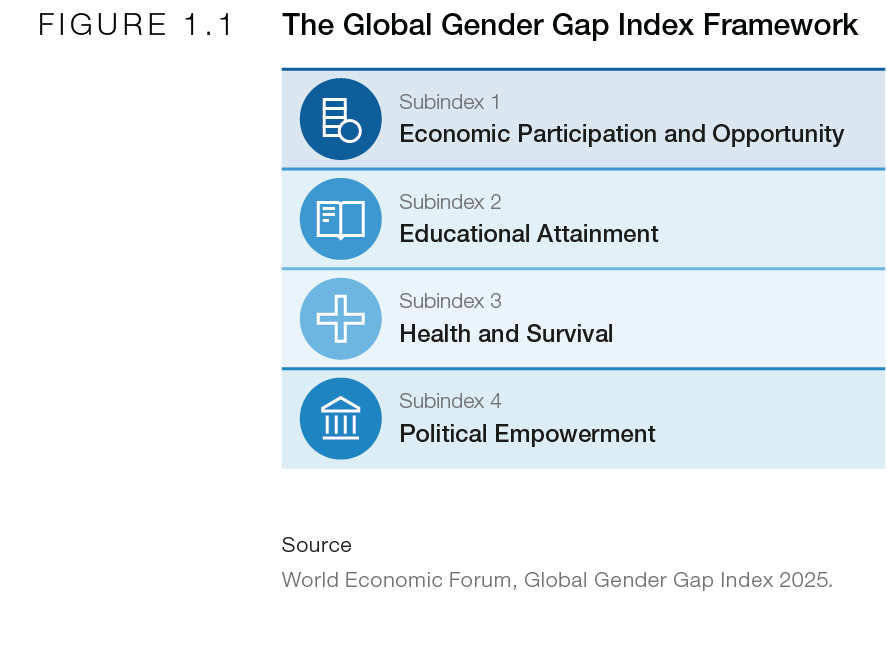
The Global Gender Gap Index was first introduced by the World Economic Forum in 2006 to benchmark progress towards gender parity across four dimensions: economic opportunities, education, health and political leadership (Figure 1.1).

Throughout its 19 editions, the index has intended to offer a stable metric for the assessment of changes in gender parity indicators over time. Using the methodology introduced in 2006, the index and the analysis focus on benchmarking parity between women and men at global, regional and economy levels based on the latest available data.
The level of progress toward gender parity (the parity score) for each indicator is calculated as the ratio of the value of each indicator for women to the value for men. A parity score of 1 indicates full parity and a score above 1 is truncated to 1 for interpretability. The gender gap is the distance from full parity. In addition to the 0–1 scale, the index also expresses progress toward gender parity as a percentage, indicating the extent to which the gender gap has been closed on a 0–100% scale. For further information on index methodology, please refer to Appendix B.
Economy coverage
To ensure a global representation of the gender gap, the report aims to cover as many economies as possible. For an economy to be included, it must report data for a minimum 12 of the 14 indicators that comprise the index. The index endeavours to include the latest data available, reported within the last 10 years.
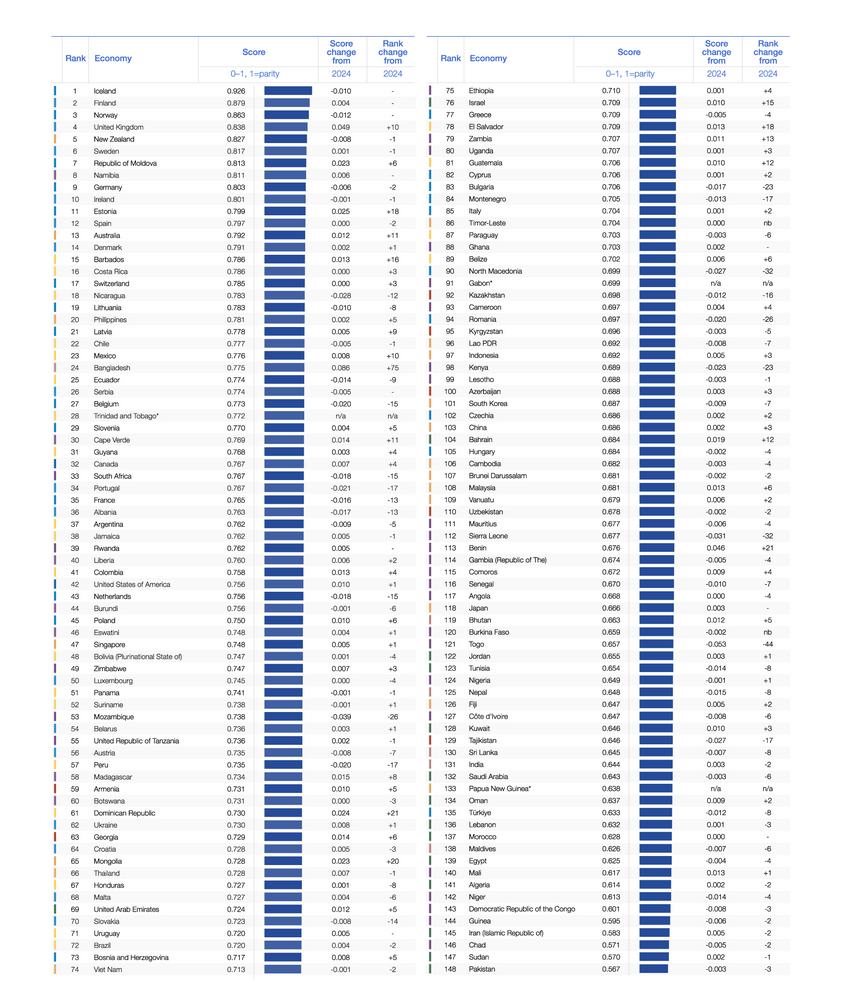
The report this year covers 148 economies. Papua New Guinea and Trinidad and Tobago return to the index in 2025, and Gabon is included for the first time. Qatar, featured in the 2024 index, is not covered infrom this edition.
Among the 148 economies included this year are a set of 100 economies that have been covered in all editions since 2006. Scores based on this constant set of economies are used to calculate and compare regional and global aggregates across time.
It should be noted that there may be time lags in the data collection and validation processes across the organizations from which the data is sourced, and that all results should be interpreted within a range of global, regional and national contextual factors. The Economy Profiles at the end of the report provide an additional broader range of data to support such analysis.
Global results
The global gender gap score in 2025 for all 148 economies included in this edition stands at 68.8% closed. When comparing the constant set of 145 economies included in both this year’s and last year’s editions, the global gender gap closed by +0.3 percentage points in 2025, from 68.4% in 2024 to 68.8% in 2025. Furthermore, when considering the constant set of 100 economies covered continuously since the inaugural 2006 edition, the gap has narrowed by 0.4 percentage points, from 68.6% in 2024 to 69.0% in 2025.
Among the 145 economies included in both 2024 and 2025 editions, slightly more than half of the economies register increases in their gender parity scores. Notable improvements are observed in Bangladesh (+8.6 percentage points), the United Kingdom (+4.9 percentage points) and Benin (+4.6 percentage points), while Estonia, Dominican Republic, Mongolia and the Republic of Moldova have also narrowed their gaps by over 2 percentage points over the same period. Conversely, Togo (-5.3 percentage points), Mozambique (-3.9 percentage points) and Sierra Leone (-3.1 percentage points) experience declines of more than 3 percentage points between 2024 and 2025. Kenya, Nicaragua, Peru, Portugal, the North Macedonia and Tajikistan see a decrease of over 2 percentage points in their scores (Table 1.1).
While the score changes reflect the progress of individual economies in achieving gender parity, the difference in rankings offer a complementary perspective on their relative performance over time. Bangladesh records the most significant improvement in ranking (+75, 24th), followed by Benin (+21, 113rd), Dominican Republic (+21, 61st) and Mongolia (+20, 65th). Eleven other economies also register double-digit increase in rankings: Australia (+11, 13rd), Bahrain (+12, 104th), Barbados (+16, 15th), Cape Verde (+11, 30th), El Salvador (+18, 78th), Estonia (+18, 11th), Guatemala (+12, 81st), Israel (+15, 76th), Mexico (+10, 23rd), the United Kingdom (+10, 4th), and Zambia (+13, 79th). On the other hand, Togo (-44, 121st), Sierra Leone (-32, 112nd) and North Macedonia (-32, 90th) experience the largest declines in ranking. Rankings for Bulgaria, Kenya and Mozambique drop by more than 20 places as well (Table 1.1).


Despite all these fluctuations in rankings, the top 10 economies continue to show a high level of stability in their configuration across editions. European economies continue to occupy most of the spots. Ranked again as number 1, Iceland (92.6%, 1st), has led the Global Gender Gap Index for 16 editions and is the only economy that has closed the gap by over 90% to date. Finland (87.9%, 2nd), Norway (86.3%, 3rd) and Sweden (81.7%, 6th) have consistently ranked in the top 10 since the first edition in 2006. Germany (80.3%, 9th) and Ireland (80.1%, 10th) are also among the top 10 this year, marking their 7th and 18th appearances, respectively. Notably, the United Kingdom (83.8%, 4th) re-enters the top 10 for the second time since its first appearance in 2006. The Republic of Moldova (81.3%, 7th) joins the top 10 for the first time. Outside of Europe, two long-standing performers stand out: New Zealand (82.7%, 5th), representing Eastern Asia and the Pacific, makes the top 10 in 18 out of 19 editions, and Namibia (81.1%, 8th), representing Sub-Saharan Africa, has held a top-10 position each year since 2021. Nicaragua (78.3%, 18th) and Spain (79.7%, 12th) drop out of the top 10 compared to the 2024 edition (Figure 1.2).
Compared to the previous edition, Morrocco (62.8%, 137th) climbs slightly and exits the bottom 10. Meanwhile, Egypt (62.5%, 139th) falls in the ranking and replaces Morrocco in the bottom 10. Alongside Egypt, the other nine lowest-ranked economies in the 2025 edition are: Pakistan (56.7%, 148th), Sudan (57.0%, 147th), Chad (57.1%, 146th), Islamic Republic of Iran (58.3%,145th), Guinea (59.5%, 144th), Democratic Republic of the Congo (60.1%, 143rd), Niger (61.3%,142nd), Algeria (61.4%, 141st), and Mali (61.7%, 140th) (Table 1.1).

Performance by income level
The sample included in this year’s Global Gender Gap Index combines a mix of high-income (51), upper-middle-income (41), lower-middle-income (40) and lower-income economies (16). Regional representation tends to be highly concentrated across these groups, with Europe having the highest representation in the high-income group (60.8%), a majority of upper-middle-income economies located in Latin America and the Caribbean (34.1%), and Sub-Saharan Africa with a large footprint in both lower-middle-income (40%) and low-income (93.8%) economic groups.
When aggregated, the average population-weighted scores show all income groups have closed more than two-thirds of their gender gap.
The index looks only at gender gaps in outcomes and not at the overall levels of resources and opportunities in an economy. It finds a slight correlation between the current income levels of the economies covered and their gender gaps, with richer economies being slightly more gender equal. High-income economies register the highest collective score, at 74.3%. The group stands at some distance from the remaining three, which score similarly – with the upper-middle income group at 69.6%, lower-middle-income at 66.0%, and low-income at 66.4% (Figure 1.3).


Variation in scores within income groups is most pronounced among high-income countries, where parity scores range from 63.7% in Oman to 92.6% in Iceland a difference of 28.9 percentage points. Smaller variations are observed among upper-middle- and lower-middle-income groups, at 23.0 and 21.7 percentage points, respectively, between the top and bottom of the ranges.With fewer economies represented, the low-income group shows the least variation, at 19.2 percentage points.
While Figure 1.3 displays a positive association between higher income and gender parity scores, it is relevant to note that economies in lower-income categories have also achieved high levels of parity. While resources matter, it is not richer countries alone that can afford to invest in gender parity and economies can integrate parity into their growth strategies at all levels of development. Historically, those who have done well at developing and integrating their full human capital tend to have more sustainable and prosperous economies as a result. Leveraging the full base of talent and diverse ideas in an economy can unlock creativity and drive innovation, growth and productivity. All individual performances within each income group are ranked and presented in Table 1.2.


Performance by subindex
This section presents the state of gender gaps across the four main components (subindexes) of the index: Economic Participation and Opportunity, Educational Attainment, Health and Survival, and Political Empowerment. In addition to presenting the aggregate subindex performance of the 148 economies included in the 2025 index, the analysis offers insights into the different indicators driving the overall average global gender gap score.
Figure 1.4 shows the gender gap scores corresponding to each of the four subindexes. The Health and Survival gender gap has closed by 96.2, Educational Attainment by 95.1%, Economic Participation and Opportunity by 61.0%, and Political Empowerment by 22.9%.


Among the 145 economies included in both the 2024 and 2025 editions, the global gender gap narrowed from 68.4% closed in 2024 to 68.8% in 2025. This progress is primarily driven by gains in Political Empowerment, which improved by 0.7 percentage points (from 22.5% to 23.2%), and in Economic Participation and Opportunity, which increased by 0.4 percentage points (from 60.3% to 60.7%). Educational Attainment and Health and Survival – both already averaging over 90% of the gap closed – each saw modest improvements of around 0.1 percentage points.
Figure 1.5 illustrates the distribution of scores across the 148 economies covered in the 2025 edition, broken down by subindex. Subindexes with greater disparities across economies tend to have lower average scores, indicating that larger gaps remain to be bridged globally.


Globally, the second-largest gap to bridge is in Economic Participation and Opportunity. Among the 148 economies covered in the 2025 edition, the score for this subindex varies from 31.3% in Sudan to 87.3% in Botswana. A majority of economies have scores within a range of 51.7% and 78.8%, between the 10th and 90th percentiles (Figure 1.5).
Among the five components of the Economic Participation and Opportunity subindex, the widest disparities across economies are observed in the parity scores for estimated earned income and the share of legislators, senior officials and managers, with differences between the maximum and minimum ratios exceeding 90 percentage points. The labourforce participation and share of professional and technical workers indicators show slightly lower disparities, with differences around 78 percentage points. The smallest disparity is observed in the parity score for wage equality for similar work, where the gap stands at 47 percentage points.
The economies that are ranked in the bottom five of the Economic Participation and Opportunity subindex are: Sudan (31.3%), Pakistan (34.7%), Islamic Republic of Iran (34.9%), Egypt (40.6%) and India (40.7%). These countries are marked by extremely low estimated earned-income ratios, with women accessing less than one-third of the economic resources available to men. They also show minimal gender parity in senior workplace roles, with females-to-males ratios not exceeding 0.4, and labour-force participation rates reflecting less than half parity between women and men (Table 1.3).
The economies that are in the top 10 of the Economic Participation and Opportunity subindex are: Botswana (87.3%), Liberia (86.5%), Eswatini (85.6%), the Republic of Moldova (85.3%) and Barbados (84.8%).Thes e economies have closed more than 85% of the gender gap in labour-force participation. They also rank among the highest for female representation in legislators, senior officials and managers, with Barbados, Botswana and Liberia achieving full gender parity in this area (Table 1.3).
Disparities across economies within the Educational Attainment subindex are relatively small. Scores for this subindex vary from 64.9% in Democratic Republic of the Congo to full parity (100%) in 35 out of 148 economies covered in the 2025 edition. Beyond the economies with full parity, 96 have closed at least 90% of the gender gap in education (Table 1.3).
Among the four components of this subindex, while almost half of the economies covered in the 2025 edition have achieved full parity, large gaps between economies are concentrated primarily in Sub-Saharan Africa. Of the 24 economies that have yet to close 80% of the adult literacy gap, 19 are located in this region. Thanks to the widespread implementation of at least nine years of compulsory education in most economies, gender gaps in primary and secondary school enrolment are relatively narrow, with minimal variation across economies. However, in terms of tertiary enrolment, Sub-Saharan Africa continues to hold some of the lowest scores. Notably, three economies – Chad, Guinea and Niger – have yet to achieve even 50% parity in tertiary enrolment.
While the report’s primary focus is how close women are to reaching parity with men – capping the femaleto-male ratio at 1 – it is noteworthy that in 109 of the economies covered in the 2025 edition, women are more likely than men to enrol in tertiary education. This includes all economies in Europe and Northern America. The gender gap in tertiary enrolment favouring women has widened in 49 economies featured in both the 2006 and 2025 editions. However, an increase in years of schooling has not necessarily translated into improved labour-market outcomes for women. Among the high-income economies covered in this edition, all have closed at least 99% of the gender gap in education, yet none have closed more than 85% of their economic gender gap. Previous Global Gender Gap Reports have highlighted the “drop-to-the-top” phenomenon, revealing persistent barriers preventing women from reaching senior leadership roles across industries and economies. This phenomenon is especially pronounced among women in STEM (science, technology, engineering and mathematics) fields.
In the Health and Survival subindex, economies are clustered towards the upper end, near full parity. The subindex score ranges from 93.4% in Azerbaijan to full parity in 17 economies. This subindex has remained moderately stable throughout the 19 editions due to two slowly progressing indicators: sex ratio at birth, and healthy life expectancy (Figure 1.6).
For most economies covered in both the 2006 and 2025 editions, sex ratio at birth has remained largely unchanged. In Albania and Georgia, the ratio increased slightly, by 0.02 and 0.08, respectively. The largest decreases over the same period are observed in India (-0.01) and the Philippines (-0.02).
In this edition, women are still projected to enjoy a longer healthy life expectancy than men in 130 out of 148 economies. However, the gender differences in healthy life expectancy have narrowed in a majority of economies with data available in both the 2006 and 2025 editions. While overall life expectancy by gender has remained more stable than healthy life expectancy, and women continue to outlive men,3 this indicates that the proportion of women’s lives spent in full health has declined relative to men. The Political Empowerment subindex demonstrates the widest variations across economies. This year, the percentage of the Political Empowerment gap that has been closed ranges from 0.6% in Vanuatu to 95.4% in Iceland. The population-weighted global average of 22.9% is skewed toward the lower end due to the poor performance of the world’s most populous economies in this area (Figure 1.5).
Out of the 148 economies covered in this edition, only nine have closed more than half of the Political Empowerment gap. The top performers in the Political Empowerment subindex closely align with the highest-ranking economies in the overall index. This is largely due to the uneven progress observed at the upper end of the Political Empowerment score distribution, in contrast to the relatively smaller range of variations across the other three subindexes. For instance, with a Political Empowerment score of 95.4%, Iceland leads the subindex, outperforming the second-ranked Finland by over 22 percentage points. Iceland also ranks first in the overall Gender Gap Index, and the only economy scoring above 90% (Table 1.3).
Results of all three components of the Political Empowerment subindex – proportion of years with a female head of state over the past 50 years, share of female ministers, and the proportion of women in parliament – show the full range of variation across economies, with scores ranging from 0 to 100%. Nearly half of the economies covered in this edition have had no female head of state in the past 50 years, while only Bangladesh and Iceland have parity in this area. At the ministerial level, five European economies (Estonia, Finland, Iceland, Spain and the United Kingdom) and two from Latin America and the Caribbean (Chile and Nicaragua) have reached full gender parity. In contrast, Azerbaijan, Hungary, Pakistan, Saudi Arabia, and Vanuatu have all-male ministerial cabinets. Full parity in parliamentary representation has been achieved by Mexico, Nicaragua, Rwanda and the United Arab Emirates, whereas Oman remains the only economy without any women in its national parliament this year.
Progress over time
The index has documented the average yearly change in the gender gap since the inaugural edition of the report in 2006. This metric, applied to a consistent sample of 100 economies included in all 19 editions, can further indicate what the rate of progress is over time, as well as estimate how long it will take to close each gender gap across the four subindexes. The results in this section discuss scores and averages for these 100 economies.
The 19-year trajectory of global gender gaps is charted in Figure 1.6.


Over the past 19 editions, global parity levels have been boosted by two different dynamics at the subindex level. Higher baselines for parity in Educational Attainment and Health and Survival have resulted in comparatively lower advances, whereas Economic Participation and Opportunity as well as Political Empowerment have exhibited more dynamism, with higher gains made over time.
Results from this edition suggest that the global pace of progress has picked up from last year, boosted by increases in almost every metric of economic, political and educational parity tracked by the index. The Global Gender Gap Index has improved +4.8 percentage points, from 64.1% in 2006 to 69.0% in 2025 – its highest score to date, above pre-pandemic levels. Spaced over 19 editions, the total gain over the gender gap yields a yearly average progress of 0.25 percentage points. If economies were to continue to advance at this estimated rate of progress, global gender parity would be attained in 123 years – reducing last edition’s estimates by a full decade but overshooting Sustainable Development Targets (SDGs) by well over a century – 118 years, to be exact.
Since its launch, nearly every dimension of the index has registered some advancement. The most progress since 2006 has been made in Political Empowerment, with a total gain of +9 percentage points from its original score of 14.3% to the latest of 23.4%. Compared to 2024, results from this edition notably improved by nearly one percentage point (+0.8), translating to a shortened timeline for the achievement of political parity of 162 years, compared to last edition’s estimate of 169 years. Nevertheless, Political Empowerment remains the subindex where the gender gap is largest, at 76.6%.
Economic Participation and Opportunity has gained +5.6 percentage points over time, from a 2006 score of 55.1% to a 2025 score of 60.7% – registering the second strongest performance among subindexes, while continuing to be the second largest gender gap in the index. Compared to last year, nearly every indicator showed increased parity scores, contributing to an overall subindex increase of half a percentage point since 2024. Based on this improved speed of progress, economic parity is 17 years closer than in last edition’s estimates, at 135 years.
Educational Attainment has increased its initial 2006 score of 90.8% to 95.7% in 2025, the highest to date. Every indicator in the subindex has slightly improved parity scores compared to 2024, with three of the four indicators having closed over 96% of the gender gap. A modest +0.2 percentage point improvement reset the timeline for educational parity to 17 years, compared to the 20-year estimate from the 18th edition. In contrast, Health and Survival stands as the one subindex with a negative evolution over time. The initial score posted in this subindex was 96.3% in 2006, which has since decreased to 96.1% in 2025. While parity in sex ratio at birth has continued to improve, it has failed to counter parity decreases in healthy life expectancy, which has subsequently pushed the subindex performance below others.


Performance by region
In line with its prior editions, the Global Gender Gap Report 2025 groups economies into eight regions: Central Asia, Eastern Asia and the Pacific, Europe, Latin America and the Caribbean, Middle East and Northern Africa, Northern America, Sub-Saharan Africa, and Southern Asia. Economies in each regional group are listed in Appendix A.
Around the world, progress toward gender parity traces different routes – and the collective efforts of the 148 economies included in the 2025 Global Gender Gap Index suggest there are three progress points for regions (Figure 1.7). Northern America, Europe, and Latin America and the Caribbean lead the regional scoreboard, each closing around three-quarters of their gender gaps, with scores of 75.8%, 75.1% and 74.5%, respectively. In the middle are Central Asia (69.8%), Eastern Asia and the Pacific (69.4%), and Sub-Saharan Africa (68.0%), steadily approaching the 70% threshold. At the lower end of the ranking are Southern Asia (64.6%) and the Middle East and Northern Africa (61.7%), having bridged about two-thirds of the gender gap. Only five of the eight regions score ahead of the 2025 global gender parity average of 68.8%.


Below the headline numbers lie the building blocks of regional performance. Figure 1.8 breaks down the overall gender parity scores by subindex, showing where gaps are widest for individual regions, as well as where regional efforts are aggregating into better global results.


In 2025, Educational Attainment and Health and Survival are the two dimensions where regions perform best overall. Nearly all regions have closed over 90% of the gender gap in Educational Attainment – with Sub-Saharan Africa, scoring 85.6%, the exception. Only Northern America has achieved full educational parity. In terms of Health and Survival, all regions show gender parity levels over 95%, but only Central Asia, Latin America and the Caribbean, and Northern America score over 97%. Where performance is third best is in Economic Participation and Opportunity. Here, regional parity scores are widely dispersed – the lowest, at 40.6%, in Southern Asia, and the highest, 76.1%, in Northern America. The distance between low and high performers pulls the overall global average down to 61.0%, despite having three regions with economic parity levels over 70%. In Political Empowerment, regional parity scores are somewhat less dispersed, yet the distance between the highest scoring region (Europe, 35.4%) and lowest performer (Middle East and Northern Africa, 10.5%) stretches to 23.8 percentage points.
While complete gender parity has yet to be achieved, regional progress recorded thus far is collectively and overwhelmingly positive. Drawing from a constant sample of 100 economies included in the index since 2006, the report traces the evolving gender parity paths of all eight regions. As Figure 1.9 illustrates, each region charts an individual trajectory towards parity that reflects the range and pace of progress made by economies in that regional group. Where a broad and global set of economies pulls collectively and steadily forward, regional performance can reveal a more pronounced upwards trajectory – Latin America and the Caribbean is a prime example.


Since 2006, economies in Latin America and the Caribbean have collectively advanced the most out of all regions, a total of +8.6 percentage points, for a 2025 score of 74.5%. Their efforts have moved at an average annual pace of nearly half a percentage point – three times as fast as Central Asia (69.8%) and over twice as fast as Eastern Asia and the Pacific (69.4%). At this rate, economies in Latin America and the Caribbean would close the gender gap in 57 years. Over two percentage points behind them, in terms of overall advancement, is Europe (75.1%). Having closed 6.3 percentage points of their gender gap overall, European economies have nonetheless made zero progress since 2024, slowing their average annual pace to just 0.3 percentage points and placing them second in the race to parity, with 76 years of efforts ahead. Sub-Saharan Africa (68%) is the region with the third-best overall effort to date, having closed 5.6 percentage points of their gender gap since 2006. However, between last edition and this year’s, Sub-Saharan economies lost -0.2 percentage points in their score, reducing the momentum built to date and leaving parity 107 years away.
Out of the remaining regions, only Northern America has closed over 5 percentage points of its overall gender gap (5.2 percentage points). The two economies in Northern America have been moving at an average annual pace of 0.3 percentage points per year, positioning the region as a whole in third place in terms of achieving full parity, at an estimated 89 years. Having closed between 3 to nearly 5 percentage points of their gap are Eastern Asia and the Pacific (3.3 percentage points), Middle East and Northern Africa (3.9 percentage points), and Southern Asia (4.9 percentage points). All three regions registered modest improvements since the 2024 edition of the index, ranging between 0.3 to 0.9 percentage-point increases in their overall scores. Of the three, Southern Asia is expected to reach parity first, in 138 years, followed by Eastern Asia and the Pacific, in 179 years, and Middle East and Northern Africa, in 185 years. The region that has reduced its gender gap by the lowest amount is Central Asia, with 2.7 percentage points. Its average annual rate of progress rises to just 0.1 percentage points, giving economies in the region a projected timeline to parity of 208 years.
Central Asia
Central Asia places fourth out of all eight regions with an overall gender parity score of 69.8%. Of the seven economies that make up the Central Asia grouping, four of them are listed in the top 100, but only Armenia (59th) and Georgia (63rd) register scores over 70% (73.1% and 72.9%, respectively). Nevertheless, the score dispersion within the region is low, suggestion the region moves in relative unison – only 8 percentage points separate Armenia (59th, 73.1%) from Tajikistan (129th, 64.6%).
Central Asia is among the three top scoring regions in the Economic Participation and Opportunity (71.2%), Educational Attainment (99.3%) and Health and Survival (97.3%) subindexes, yet has the second lowest score for Political Empowerment at 11.6%.
Based on the constant sample and its performance across editions, Central Asia has closed its overall gender gap by 2.7 percentage points since 2006. The most notable gains have been made in Economic Participation and Opportunity and Political Empowerment, where parity improved by 5.6 and 5.3 percentage points, respectively. Despite a 1 percentage-point overall loss in labour-force participation parity since 2006, economic parity has progressed due to significant gains in economic representation, with the gender gap among senior officials, managers and legislators narrowing by nearly 0.2 percentage points. Among the seven economies in the region, however, only Georgia, Kazakhstan and Azerbaijan have closed more than 70% of the economic gap, with scores of 72.4%, 71.5% and 74.8%, respectively.
Since 2006, regional gender parity in Educational Attainment has receded by 0.3 percentage points. With sustained virtual parity in primary and tertiary enrolment, increases in gender parity in literacy are overshadowed by a reduction in secondary enrolment parity, which pulls the overall subindex score down. Six economies in the region are making gains towards educational parity with scores over 97%, while only Tajikistan trails behind (93.9%).
Finally, despite having the lowest regional score in Political Empowerment, Central Asia has made remarkable strides over time. Since the index launched, the region has leaped forward with an 8.2 percentage -point increase in ministerial representation and a 10 percentage-point improvement in parliamentary parity. Armenia, Georgia and Uzbekistan lead the region with political parity scores over 20%.
Eastern Asia and the Pacific
Eastern Asia and the Pacific ranks 5th in this edition’s regional ranking, with a score of 69.4%. Approximately 52.6% of the regional block ranks above 100 in the overall index, but only one economy features in the top 10 (New Zealand, 5th, 82.7%). Over the course of 19 editions, the block has reduced overall gender disparity by -3.3 percentage points.
In 2025, Eastern Asia and the Pacific has the second-highest regional score for Economic Participation and Opportunity at 71.6%. The region’s strong economic performance reflects a relative level of concentration in scores, with 12 of the 19 economies scoring within a range of 70%-80%. Only one economy, Fiji (126th, 64.7%) has closed less than 60% of its economic gap (58.8%). Over time, the region has closed 9.2 percentage points of the economic gap, recording impressive advances in senior and overall workforce representation, improving parity by 31.1 and 16.3 percentage points, respectively, since 2006. In 2025, 17 of the 19 economies in the region have a female labour-force participation rate of over 40%, the highest of which is recorded in Cambodia (73.7%).
The region has the second-lowest score for Educational Attainment at 95.3% and has lost –0.8 percentage points in educational parity over time. Basic educational parity has dropped over time by –2.2 percentage points in primary education enrolment. The region’s declining performance in education continues in 2025, with Lao PDR, Philippines and Papua New Guinea posting female rates for primary education enrolment of under 90%.
Across regions, Eastern Asia and the Pacific places the lowest in Health and Survival with a score of 95.5%. Only 15 of the economies in the regional block have over 96% in health parity in 2025, a metric skewed by comparatively lower levels of parity in birth ratios in Viet Nam, China, Brunei Darussalam and Papua New Guinea, as well as absence of parity in healthy life expectancy in 14 of the economies.
Eastern Asia and the Pacific also ranks sixth in Political Empowerment, having achieved 15.3% political parity. Despite narrowing the political gap by 4.1 percentage points since the index launched in 2006, the region advances slowly in this dimension – in part because performance is so uneven among economies. In 2025, only New Zealand (60.5%) has passed the 50% threshold for parity in this subindex, while Japan, Cambodia, Malaysia, Brunei, Fiji, Papua New Guinea and Vanuatu trail behind with scores under 10%. Nine of the 19 economies have had no female head of state, and only seven have cabinets where women represent at least one in five ministers. The same ratio holds more broadly – in 12 of the economies across the region – for parliamentary representation,.
Europe
Displaced by Northern America in 2025 from the top rank, Europe places second in this year’s edition with an overall gender parity score of 75.1%. The block is comprised of 40 economies; eight are in the top 10 and 37 of are in the top 100. The region’s high score is achieved despite having relatively high score dispersion, with 29 percentage points separating Iceland’s 92.6% overall gender parity score from Türkiye’s (63.3%). Since 2006, Europe’s trajectory across three of the four subindexes has trended upwards. As a result, Europe has closed 6.3 percentage points of its overall gap.
In 2025, Europe places fourth out of all regions in Economic Participation and Opportunity (68.4%). In terms of performance, 35.0% of the regional block has closed three-quarters of the economic gap, while another 7.5% is yet to pass the 60% parity mark. Since the launch of the index, Europe has closed its economic parity gap by 8.6 percentage points, and most notably, reduced gender disparity in senior and technical and professional representation categories by 13.9 and 12.4, respectively.
The region ranks third in Educational Attainment (99.6%), having reduced educational disparity by a modest 1.5 percentage points since the index was launched. 32.5% of the regional block has achieved full educational parity, and the remaining ones are within 5 percentage points of doing so. Modest advances have been made in primary and secondary education enrolments, with advances under 3 percentage points. Parity in literacy, by contrast, has receded by 0.1 percentage points. Where Europe has made the most progress to date is in tertiary education enrolment, where gender parity has increased by 4 percentage points since 2006.
In Health and Survival (96.9%) Europe ranks fourth out of all regions, showing a nearly 1 percentage-point loss since its first score was indexed. This devolution follows a decrease in parity in healthy life expectancy of –2.6 percentage points.
In striking comparison, Europe boasts the highest regional score in Political Empowerment with 35.4%. The achievement is especially remarkable in light of the high score dispersion in this category, where the difference between the highest (Iceland, 95.4%) and lowest score (Türkiye, 5.9%) is 89.5 percentage points. Regional advances in Political Empowerment nearly double those of Economic Participation and Opportunity, with gains since 2006 of 16.0 and 8.6 percentage points, respectively. Since the launch of the index, all three metrics for political parity show significant improvement, with increases of 10.8 percentage points for years with a female head of state, 21.1 percentage points for ministerial parity, and 25.6 percentage points for parliamentary parity. Out of all regions, Europe has the third-highest ministerial and second-highest parliamentary scores of the 2025 index, at 55.3% and 53.3%, respectively.
Latin America and the Caribbean
Latin America and the Caribbean stands out in the 2025 edition of the Global Gender Gap Index as the third-ranked region, with a gender parity score of 74.5%. Comprising 23 economies, the region has made the greatest overall progress since the index’s inception in 2006 – closing 8.6 percentage points of its gender gap.
Despite achieving the third-lowest score globally in Economic Participation and Opportunity (65.6%), Latin America and the Caribbean has made significant headway, narrowing its economic gap by 9.9 percentage points since 2006. As of 2025, every country in the region has closed at least 50% of its economic gap. The region also demonstrates strong internal consistency in this dimension, with less than 8.4 percentage points separating the top and bottom performers.
Notable improvements in economic parity are seen in leadership and workforce representation. Since 2006, parity scores for senior officials, managers and legislators have risen by 18 percentage points, while parity in professional and technical roles improved by 8.8 percentage points. In 2025, women hold an average of 42.9% of senior economic leadership positions, though disparities persist, with more than 32 percentage points separating economies within the region. Workforce parity is a brighter spot: 14 economies report full parity in professional and technical roles, and the lowest score in this category (El Salvador, 80.8%) remains well above the global average of 72.0%.
The region records the third-highest score in Educational Attainment (99.6%), with only a 1.6-percentage-point improvement since 2006 – reflecting the region’s near-parity baseline level. Ten economies have reached full educational parity and the remainder are within 3 percentage points of doing so. Thirteen economies have achieved full parity in literacy, with Guatemala as the outlier, posting a female literacy rate of 78.6%, well below the regional norm. In primary education, parity is uneven. While countries like Uruguay report near-universal female enrolment (99%), Trinidad and Tobago, Honduras and Suriname still report enrolment rates under 80%, highlighting areas for renewed focus.
Latin America and the Caribbean achieves the highest regional score for Health and Survival (97.7%), with tightly clustered national scores – less than 1.5 percentage points separating the top and bottom. All 23 economies have achieved parity in sex ratio at birth, underscoring widespread progress in basic health equity.
Political parity has seen transformative gains, with the region ranking second globally (35%) and achieving a 23.3 percentage-point improvement since 2006. Across the block, progress is broadbased: gender parity has risen by 7.7 percentage points in heads of state, 40.5 in ministerial roles, and 31.9 in parliamentary representation. The region boasts a strong record of female political leadership: 15 economies have had a woman as head of state in the past five decades. In 17 economies, women make up at least one-third of the cabinet and all economies include women in parliament – with Mexico and Nicaragua posting full parliamentary parity.
Middle East and Northern Africa
Middle East and Northern Africa ranks eighth in the 2025 edition of the Global Gender Gap Index, with a regional gender parity score of 61.7%. Comprising 14 economies, the region has made moderate progress since 2006, closing 3.9 percentage points of its overall gender gap. While it remains the lowest-ranked region, its trajectory signals gradual improvement.
Economic Participation and Opportunity remains the region’s greatest challenge, with an average score of 42.4% – the second-lowest globally. Internal disparities are pronounced: top performers like Israel (73.0%) and Bahrain (65.6%) more than double the scores of Sudan (31.3%) and Iran (Islamic Republic of) (34.9%). Structural gaps persist, with men participating in the workforce at nearly four times the rate of women in economies such as Algeria, Egypt, Iran (Islamic Republic of), Jordan, and Sudan. Yet bright spots are emerging. Jordan reports over 50% female representation among senior officials and managers, and women make up a majority of professional and technical workers in both Israel and Lebanon.
The region ranks fifth globally in Educational Attainment (97.6%), having gained 5.4-percentage- points since 2006. Most economies are nearing full parity, but disparities in educational outcomes remain. For instance, while Sudan and Egypt post literacy parity scores around 86%, absolute literacy rates for both men and women are significantly lower than the regional average. Similarly, Lebanon and Sudan lag in primary enrolment for both genders, revealing deeper systemic barriers masked by aggregate parity scores.
In Health and Survival, the region places sixth with a score of 96.2%. Although all economies have achieved parity in sex ratio at birth, large differences in healthy life expectancy persist. For example, in Sudan, both men and women can expect just 58.5 years of healthy life – over a decade less than their Israeli counterparts, where life expectancy exceeds 70 years.
The region continues to trail in Political Empowerment, with the lowest global score of 10.5%. Still, the regional average has more than tripled since 2006, gaining 8.3 percentage points. The United Arab Emirates is the regional leader in the subindex with a political parity score of 37.2%, ranking 32nd globally. It far surpasses the next-best performers – Morocco (18.8%), Egypt (15.7%), and Tunisia (15.7%). Morocco (26.3%) and Tunisia (25.0%) register the highest levels of female representation in ministerial positions. Only Israel and Tunisia have had a woman head of state in the past 50 years.
Northern America
In this edition, Northern America occupies first place in the regional ranking with a score of 75.8%. The regional grouping comprises just two economies – Canada and the United States – whose combined population means the regional performance has a significant impact on overall global averages. Over time, the region has advanced a total of 5.2 percentage points in overall parity. The region also ranks first in Economic Participation and Opportunity, with a score of 76.1%. However, compared to other regions, Northern America has made virtually no progress in economic parity since the index was launched in 2006, increasing its score by a mere 0.6 percentage points in 19 years. Mixed results across economic indicators explain the limited progress: despite parity in workforce participation climbing 3.2 percentage points over time, the region has also seen parity in senior economic representation decrease by -6.8 percentage points.
Having achieved 100% of educational parity, Northern America leads the regional table on Educational Attainment. Over time, however, Northern America has advanced its educational parity baseline by only a modest 1.7 percentage points. Across all three enrolment indicators, the region displays healthy rates of female enrolment across primary, secondary and tertiary education levels. However, a pronounced disparity appears on the side of male enrolment rates at tertiary level, which stand nearly 30 percentage points below female rates in the United States and 26 points in Canada.
Northern America ranks third in Health and Survival with a score of 97.2%. Both economies have achieved parity in sex ratio at birth. Healthy life expectancy is higher for women than for men in both countries, contributing to the observed parity score.
In Political Empowerment the region places third, behind its hemispheric and Atlantic neighbours, with a score of 29.7%. Since the index was launched, this is the dimension where the region has made most progress, narrowing its political parity gap by 19.3 percentage points. The region’s increase in ministerial parity is the indicator that has pushed the region forward in this dimension, raising its initial parity score by a striking 50.4 percentage points over time.
Southern Asia
Southern Asia ranks seventh in the 2025 edition, having closed about 64.6% of its overall gender gap. Of the seven economies that integrate the block, only one places in the top 50: Bangladesh (24th, 77.5%). Over the course of 19 editions, the region has narrowed its gender gap by 4.9 percentage points.
With the lowest Economic Participation and Opportunity score among all regions at 40.6%, Southern Asia is yet to close two-thirds of the economic gender gap. Economies within the block register high levels of score dispersion in this subindex, evidenced by the 34.6 points that separate Pakistan (34.7%) from Bhutan (69.3%). Overall, the region has only inched forward by 0.8 percentage points since 2006. However, this number masks what is in fact a very heterogenous economic parity trajectory. Over time, Southern Asia has significantly improved parity in economic representation, with increases of 9.1 percentage points for senior officials, managers and legislators, and 17.2 percentage points for professional and technical workers. These advances accompany a modest 1.3 percentage-point parity jump in labour-force participation rate. At the same time, the region has seen parity decrease in estimated earned income by 7.8 points.
In Educational Attainment, Southern Asia places sixth among regions, with a 95.4% parity score. Over time, the region has made substantive progress to advance educational parity, resulting in a 14.4-percentage-point increase from its 2006 score. The most significant shift the region has made over the past 19 editions is a 20.1 percentage-point parity increase in literacy, and a 31.1% parity increase in tertiary education enrolment. Despite this achievement, economies continue to show high levels of variance in female shares of literacy: in Pakistan, only 48.5% of women are literate, compared to 98% in the Maldives.
The Health and Survival score of Southern Asia is 95.5%, second from the bottom in the regional scoreboard. Over time, this subindex has seen limited movement, and the sparse advances registered in healthy life expectancy (+0.9 percentage points) are countered by parity losses in sex ratio at birth (-1 percentage points).
In Political Empowerment, Southern Asia places fourth among regions, having a political parity score of 26.8%. In 2006, the region had the highest baseline score of all regions at 21.9%. Since then, it has advanced political parity by 4.9 percentage points – a solid effort that nonetheless has been outstripped by other regions. Of the seven economies in the block, there are two where women have not yet been head of state and only Bangladesh has achieved political parity at the head-of-state level. Only in Bangladesh do women represent around one-fifth of ministers (18.2%). At the parliamentary level, Bhutan and Maldives are the only two economies with parity scores under 5%.
Sub-Saharan Africa
Sub-Saharan Africa ranks sixth among regions in the 2025 Global Gender Gap Index, with an overall gender parity score of 68.0%. Since 2006, the region has improved its parity score by 5.6 percentage points. Comprising 36 economies, the region displays significant heterogeneity in parity outcomes. The highest-ranked country, Namibia (81.1%), places 8th globally and is the only Sub-Saharan African economy in the global top 10 in 2025. Historically, Namibia has featured in the top 10 six times. At the other end of the spectrum, Chad ranks 146th with a score of 57.1%, resulting in a 24-percentage-point gap between the top and bottom performers. Twenty economies in the region place in the global top 100.
In Economic Participation and Opportunity, SubSaharan Africa ranks fifth, with a score of 67.5%, marking a 4.8 percentage-point improvement since 2006. The region presents diverse performance profiles in this dimension: Chad records the lowest score (44.4%), while Botswana leads globally (87.3%). Female labour-force participation ranges from 39.2% in Senegal to 80.7% in Nigeria. Representation of women in senior economic leadership varies widely, from 11.6% in Chad to 69.9% in Burkina Faso. The region has achieved a 35.1 percentage-point improvement in parity for senior officials, managers and legislators, and a 12-point gain in labour-force participation parity.
Sub-Saharan Africa ranks eighth in Educational Attainment, with a score of 85.6%, up 5.2 percentage points since 2006. This improvement is largely driven by gains in educational enrolment parity, though challenges remain. Female literacy parity has declined by 1.5 percentage points over time, and in 2025, female literacy rates remain below 50% in 13 economies. Female enrolment in primary education remains below 80% in nearly one-third of the region’s economies. Further, at the tertiary level, only Mauritius has enrolment rates above 30% for both men and women. In line with other regions, women surpass men in tertiary enrolment rates.
In Political Empowerment, Sub-Saharan Africa ranks fifth, with a score of 22.2% – a 12.4 percentagepoint improvement since 2006. At the launch of the index, the region scored zero for years with female head of state; by 2025, parity in this indicator has reached 3.2%. Ministerial and parliamentary representation has also seen substantial gains: women now hold 40.2% of ministerial roles and 37.7% of parliamentary seats, up from under 20% in both categories in 2006. Rwanda is the only economy in the region to achieve full parliamentary parity, with South Africa (81%) and Cape Verde (80%) close behind. All 36 economies have women in ministerial positions, though representation varies widely – from 45.5% in Ethiopia to just 8% in Mauritius.


In-focus country performances: Top 10 and most populous
This section reviews the state of gender parity for selected individual economies, examining performance across the four dimensions of the index as well as the economies’ trajectories followed to date. The economies in this section are both statistically and strategically significant to monitoring and benchmarking efforts, given their placement in the index as well as the share of the global female population they represent.
Top 10 economies
Iceland
Iceland has ranked at the top of the Global Gender Gap Index since 2009. Since the inaugural edition in 2006, the economy has demonstrated a consistently positive trajectory, not only maintaining its leading position, but also widening its score relative to global averages over time. Iceland has increased its overall gender parity from 78.1% in 2006 to 92.6% in 2025, while the gap between its score and the global average has expanded from 14.0 percentage points to 23.6 percentage points over the same period. Iceland’s overall gender parity ranking is primarily driven by its outstanding performance in the Political Empowerment subindex. To date, the economy has closed 95.4% of the gender gap in politics – four times higher than the global average and more than twice the average of its European peers. Iceland has achieved full parity in ministerial positions since 2024 and in the head-of- state role since 2023. In contrast, Iceland’s performance in the Economic Participation and Opportunity subindex has shown more fluctuations. This year, its score stands at 79.8%, lower than its peak of 84.6% in 2021. The decline is mainly attributed to a drop in estimated earned income (67.6% in 2025 against 73.7% in 2021) and reduced female representation among legislators, senior officials and managers (58.2% in 2025 against 72.1% in 2021). A downward trend is also observed in the Health and Survival subindex. Here, Iceland’s parity score has been gradually declining for almost a decade, from 97.0% in 2016 to 96.0% in 2025. Although the absolute decrease appears modest, the score now falls below both the European and global averages. Notably, despite generally long healthy life expectancies, women in Iceland are projected to have a shorter healthy lifespan than men for the first time in a decade.
Finland
Finland ranks 2nd in 2025, having closed 87.9% of the overall gender gap to date. This economy has consistently remained among the top five economies since the first edition in 2006. In the Economic Participation and Opportunity subindex, Finland has shown a moderately positive trend with minor fluctuations over time. This year, its economic parity score returns to its peak in 2015, reaching 81.5%. In particular, parity among legislators, senior officials and mangers has steadily improved, rising from 38.9% in 2006 to 62.4% in 2025. Its score for perceived wage equality has also reached the highest level in 2025, at 81.4%. In parallel, the estimated earned income score has increased over the past nine editions, reaching 75.2%, though it has yet to surpass the record high achieved in 2015 (81.3%). Finland maintains its strong performance with full parity in education and near-complete parity in health. A slight decline in female parliamentary representation has led to a drop in its Political Empowerment score, from 73.4% in 2024 to 72.8% in 2025. Despite this, with full parity in ministerial positions and half-parity achieved in the head-of-state role, Finland ranks second in the global Political Empowerment ranking.
Norway
Norway ranks 3rd in 2025, with an overall score of 86.3%, and continues to be one of the perennial top performers in the Global Gender Gap Index. Although it maintains its relative position among leading economies, recent years have seen declines across the Economic Participation and Opportunity, Health and Survival, and Political Empowerment subindexes. Notably, its score for estimated earned income falls to its lowest level since 2016, at 71.5%. Similar to Iceland, women in Norway now face slightly shorter healthy lifespans than their male counterparts, which has contributed to the Health and Survival subindex score decreasing from 96.2% to 95.9% between 2024 and 2025. In the political sphere, a decline in the representation of women in parliamentary and ministerial positions has offset consistent progress in the representation of women as head of state, leading to a decrease in Norway’s overall Political Empowerment score, from 74.6% in 2024 to 72.1% in 2025.
United Kingdom
The United Kingdom rises to 4th in the Global Gender Gap Index, marking the first time the economy has closed over 80% of its overall gender gap (83.8%) and secured a position among the top 5. A historic gender-equal cabinet is the primary driver of this achievement, complemented by an increase in women representation in the parliament. As a result, the United Kingdom’s Political Empowerment score has increased from 47.4% in 2024 to 64.3% in 2025. Positive developments have also been recorded in the Economic Participation and Opportunity subindex. In particular, the share of women among senior roles at the work place has improved over time. Parity in legislators, senior officials and managers stands at 67.3% in 2025, up from 58.3% in 2024 and 49.3% in 2006.
New Zealand
New Zealand ranks 5th in 2025, with an overall gender parity score of 82.7%, marking a slight decline from its peak of 85.6% in 2023. After notable progress between 2019 and 2023, the Political Empowerment subindex has experienced setbacks. Parity in ministerial positions has dropped by nearly 30 percentage points, from 81.8% in 2023 to 53.8% in 2025. Similarly, parity in parliamentary representation now stands at 83.6%, down from full parity achieved in 2023. The Economic Participation and Opportunity subindex exhibits a downward trend, despite minor fluctuations over time. There is further a decline in executive perceptions of wage equality. In 2025, New Zealand falls below the 70% parity threshold for the first time since 2007.
Sweden
In 2025, Sweden is positioned 6th with a score of 81.7%. However, these results fall within the narrow trajectory Sweden has been tracing since the index was launched in 2006. The economy has advanced just 0.4 percentage points over time and this year fell below its best parity score of 82.3%, achieved in 2015 and again in 2021. Despite this, the state of economic parity in Sweden is much improved from last year, shifting from 79.4% to 81.8% in 2025. The labour-force participation rate increases for both men and women, but the jump in the female participation rate was significantly higher. Similarly, higher rates of female representation in senior economic roles (+6 percentage points) boosts the parity score for these indicators and the subindex overall. In Educational Attainment, Sweden achieves full parity across indicators on account of women engaging with educational opportunities in equal or higher shares than men. While parity in the literacy and primary enrolment indicators results from a healthy equilibrium in male and female engagement, secondary and tertiary enrolment indicators show that women have significantly outpaced men’s level of engagement, to the point of nearly duplicating their participation in tertiary education (104.1% for women vs 61% for men). In Health and Survival, Sweden has seen parity decrease over time by –1.1 percentage points. In 2025, a reduction in healthy life expectancy reduces last year’s parity score, leaving both men and women with a slightly lower healthy lifespan and the economy with a slightly lower health parity score. In Political Empowerment a lower share of women in parliament reduces parliamentary parity by -5.8 percentage points and contributes to nearly a two-point reduction of the subindex score (48.8%).
Republic of Moldova
Moldova enters the top 10 for the first time in 2025, placing 7th overall after improving its overall gender parity score (81.3%) by +2.3 points and climbing six ranks from 2024. Since the index was launched, Moldova has narrowed its overall gender gap by 10 percentage points, from 71.3% to 81.3%, its highest score to date. The subindex where Moldova sees the second-most significant shift from last year’s edition is Economic Participation and Opportunity. Moldova has increased economic parity by +1.6 percentage points, while maintaining parity in technical and professional workers, and virtually similar levels of parity in senior officials, legislators and managers compared to last year. Throughout all editions, Moldova has seen some fluctuation in its economic parity score. While the economy has posted stronger scores in the past two editions, it is yet to surpass its 2023 score of 86.3%. Educational Attainment is only slightly diminished from 2024, where a drop in secondary enrolment parity is higher than the increase in parity for literacy. In Health and Survival, Moldova registers no change since 2024. Where Moldova has made most advances since the last edition (+7.5 points) is in Political Empowerment, for a 2025 parity score of 42.5%. Compared to 2006, Moldova has more than tripled its political parity score. With an incumbent female head of state leading the economy since 2020, Moldova registers a slightly higher score in this category (18.2%) from last edition. Parity in parliamentary representation decreased somewhat since the last edition (from 68.9% to 66.7%). Nevertheless, the share of female ministers increases from 21.4% to 35.7% over the past year, leading to a +28.3 percentage-point increase in ministerial parity. This raises the subindex score, overall parity score, and the economy’s position in the overall rankings.
Namibia
Placing in the top 10 for the 6th time, Namibia ranks 8th in 2025 after closing its overall gender gap by 81.1%. The economy advances by +.6 percentage points, which contributes to a +12.4-point advance it has recorded since the index was first launched. This year’s results are bolstered by score increases in economic and political parity, the two dimensions where Namibia has made the most gains over time (+18.3 points and +29.5, respectively). Parity in estimated earned income decreased from last edition, despite values increasing for both men and women. However, men’s income rose more significantly than women’s, leading to higher income disparity. Gender parity in workforce representation indicators has not changed from the last edition. Newer values for both indicators – senior officials, managers and legislators as well as professional and technical workers – would be needed to determine meaningful changes over the past few years. Namibia continues to maintain full parity in Educational Attainment. Updates from last edition reveal, however, that in tertiary education both male and female shares of enrolment have decreased – women’s more significantly than men’s, but not sufficiently to place men’s enrolment rates on par with women’s (33.1% for women vs. 19.2% for men). In Health and Survival, Namibia also retains parity, although healthy life expectancy for both women and men has decreased since the last edition, from 58.6 and 53.4 years to 54.6 and 51 years, respectively. In Political Empowerment, Namibia saw its parity scores for women in ministerial positions as well as female head of state increase, by +12.2 and +3.2 percentage points, respectively. Notably, the ministerial representation of women rose from 31.6% to 38.8%. Parliamentary parity, on the other hand, decreased by –10.8 points since the last edition.
Germany
Placing in the top 10 for the 7th time, Germany ranks 9th overall, falling in both rank (-2) and score (-.6 points) compared to last edition. When the index was first launched in 2006, Germany registered a high parity baseline at 75.2%. Since then, the economy has narrowed its gap by 5 percentage points. Economic Participation and Opportunity is one of the most static index dimensions for Germany, with the economy’s performance slowing down since 2012. In this edition, Germany registers a 68% economic parity score but shows little movement across indicators. Germany maintains parity in technical and professional workers, where women make up a majority of the workers in the category at 51.9%. In comparison, women’s representation in senior economic roles pales slightly, with women holding just under a third of total worker representation (28.6%) compared to men’s 71.4%. Educational Attainment sees a slight improvement, primarily from improvements in secondary education enrolment. In this indicator, enrolment rates went up for both men and women, with a significant increase to the former. Female enrolment shares in tertiary education also increased from the 2024 edition; however, as women already outpace men in this domain beyond the range reflected by the truncated score, there are no changes to parity. Similar to other economies, Germany sees a decrease in healthy life expectancy – part of a three-year downward trajectory beginning in 2021 – compared to men, which brings down its Health and Survival score. In Political Empowerment, gender parity decreases compared to the previous edition by –2.5 points, namely in the parliamentary indicator, after women’s representation in parliament decreases from 35.3% in 2024 to 32.4%. Women’s representation in ministerial positions remains virtually the same as in the 2024 edition. Germany narrows the political gap by +21.4 percentage points over time, yet over the past two editions has fallen short of improving its 2023 score of 63.4%.
Ireland
Closing the top 10 with a score of 80.1% is Ireland. The European economy registers a slight –0.1 decrease from last year’s score that also contributes to a one-rank drop in the index. Despite this setback, Ireland maintains a largely positive parity dividend, having advanced its position by +6.8 percentage points since 2006 and showing a consistently upwards trajectory towards parity. Consistent with this trend is Ireland’s performance in Economic Participation and Opportunity. Since 2006, Ireland has narrowed its economic gap by +11.5 points. Contributing to this trend is Ireland’s performance over the past year, as it has further narrowed its economic parity gap by +1.8 points, registering a 75.5% score. Ireland maintains parity in professional and technical workers, with female representation improving from 51.9% to 52.5% in one year. Female representation in senior economic roles shows a 1 percentagepoint decline, and parity in labour-force participation has also declined due to male values increasing more than women’s. Despite this, Ireland registers its third consecutive annual improvement in parity, placing it on a recovery pathway to reach its best economic parity score of 77.7%, posted in 2015. Ireland achieves full parity in Educational Attainment for the fourth year in a row. There are no significant changes to the parity ratio across indicators in 2025; however, it is worth noting that for both secondary and tertiary enrolment indicators, there has been a decrease in the overall enrolment shares for both men and women. In Political Empowerment, Ireland has moved forward by 16.4 percentage points since 2006 and has nearly closed half of the political parity gap at 48.8%. However, in 2025, Ireland registers a decrease in political parity that lowers its score from the 50.7% it achieved in 2024. The sole indicator contributing to score reduction is women in ministerial positions, which reflects a decline in female ministerial representation from 28.6% to 21.4%.
Most populous economies
Bangladesh
Bangladesh ranks 24th in 2025, recording the largest jump in the global gender gap ranking in one year (up 75 places). Its overall gender parity score rises accordingly, increasing significantly, from 68.9% in 2024 to 77.5% in 2025. The most substantial contributor to this progress has been the performance of the Political Empowerment subindex. The proportion of women in ministerial positions rises from 9.1% to 22.2% between 2024 and 2025. Combined with Bangladesh’s parity in the head-of-state indicator, the economy now ranks 1st in Southern Asia and 3rd globally in the political parity ranking. The Economic Participation and Opportunity subindex is the second key driver of improvement, primarily due to labour-force data revisions, which brings Bangladesh’s economic parity back to its 2023 level. Additionally, Bangladesh has made progress in bridging the gender gap in literacy, with women increasingly catching up to men in literacy rates.
Brazil
Brazil ranks 72nd in the global ranking, climbing two positions compared to last year. Brazil’s overall gender parity has improved from 71.6% in 2024 to 72.0% in 2025. Over time, Brazil has experienced two significant waves of progress in gender parity. The first occurred between 2006 and the early 2010s, driven primarily by gains in economic parity, which increased from 60.4% in 2006 to around 65.0% in the early 2010s, and to a lesser extent by advances in educational parity, which rose from 97.2% to above 99.0% since 2008. The second wave emerged after 2022, marked by a significant improvement in the Political Empowerment subindex. Between 2022 and 2023, Brazil’s political parity score rose by more than 10 percentage points, reaching over 20% and remaining at that level since. This increase is largely attributed to a sharp rise in women’s representation in ministerial positions, with the score jumping from around 10% to over 50% during that period and maintaining that level thereafter.
China
China, one of the world’s most populous countries, improves gender parity by +0.2 points since the last edition of the report, with a 2025 score of 68.6% and climbs three ranks since last year to 103rd rank. China has been on a positive trajectory for the past three editions, and on course to approach its highest score to date (69.1%, 2013). This shift results from parity increases in Political Empowerment (+1.2 points) and Health and Survival (+0.7 points) and is achieved despite a slight reduction in economic parity (-1.2 points). In Economic Participation and Opportunity, while income parity rises from 64.2% to 63.9%, it is not sufficient to counter the drop in wage parity, of –0.3 percentage points. However, compared to 2006 China has advanced economic parity by an overall +10.5 percentage points. In Educational Attainment, parity ratios are maintained with the exception of literacy rates, which show the score modestly improved from 96.6% to 96.9% despite a minimal but overall reduction in values. China’s improved sex ratio at birth has a significant effect on its Health and Parity subindex performance, raising the score from 94.0% to 94.7%. Unlike a large share of economies this year, China’s healthy life expectancy remains virtually unchanged. Political parity improves as female ministerial representation nearly doubles in 2025, from 4.7% to 8.3%, and boosts the overall subindex score from 12.3% to 13.5%.
Democratic Republic of Congo
With just under two-thirds of the gender gap closed (60.1%), the Democratic Republic of Congo (DRC) places 143rd in the overall ranking. Both numbers reflect a lower level of performance compared to the past two editions, with a decline in score of -.8 percentage points, and a three-rank drop from 2024. This downward turn is driven by parity losses in every subindex except for Political Empowerment, where DRC improves by +2 percentage points. Parity in Educational Attainment drops by –3.4%, predominantly influenced by a loss of parity in literacy. While rates for both men and women are lower than in the last edition, female rates (61.6%) are lower compared to men’s (87.5%), increasing the disparity. Similarly, healthy life expectancy has dropped for both men and women, although more significantly for women, creating a health disparity that lowers the subindex score. Where DRC makes progress is in ministerial parity, increasing female representation from 20.5% to 25% in one year and driving the indicator score to its highest level recorded, 33.3%. In a similar trajectory, parliamentary parity shifts by +0.2 points to reach 14.9%, almost doubling the economy’s 2018 score of 9.8%.
Egypt
With a population of over 100 million that tilts slightly towards a male majority, Egypt ranks 139th in the 2025 index with a gender parity score of 62.5%. Across most the remaining dimensions of the index, Egypt has a relatively stable, if not positive performance. In Economic Participation and Opportunity there are no score changes, owing to a balancing of negative variations in senior economic representation (-1.4 points) and income parity (-2.5 points) and positive shifts in female workforce participation rates (+3.3 points) and parity for professional and technical roles (+.5 points). In Educational Attainment, literacy parity improves but only because literacy rates diminish disproportionately for men. Similarly, healthy life expectancy diminishes for men more significantly than for women, thereby increasing gender parity. Where Egypt experiences a more significant score shift is at the ministerial level, where female representation declines by –7.7 percentage points, from 18.8% to 13.3%, bringing the overall subindex score down, from 17.6% to 15.7%. Overall, Egypt registers reductions in both score (-.4) and rank (-4) compared to last year.
Ethiopia
Ethiopia ranks 75th in 2025, rising four spots compared to 2024, with a modest increase of 0.1 percentage-point in its overall gender parity score. This year’s improvement is largely driven by strong performance in the Political Empowerment subindex, building on momentum since the election of its first female president, Sahle-Work Zewde, in late 2018. Ethiopia’s political parity score now stands at 48.9%, an increase of 7.7 percentage points from last year. A major contributor to this rise is a notable growth in the score of women’s representation in ministerial positions, which increases from 57.1% in 2024 to 83.3% in 2025. However, progress in other areas has been mixed. The estimated earned income score declines significantly, from 66.2% in 2024 to 55.7% in 2025, leading to a 3.4 percentage-point drop in the Economic Participation and Opportunity subindex. In Educational Attainment, the literacy rate improves for men but declines for women, resulting in a sharp 20 percentage-point drop in the literacy score: from 75% in 2024 to 55% in 2025, while gender gaps at other education levels remain largely unchanged. In the Health and Survival subindex, the healthy life expectancy score sees a slight decline of 0.4 percentage points.
India
In 2025 India ranks 131st, with an overall gender parity score of 64.4%. Compared to the 2024 edition, India sees a relative drop in rank (-3) due to the performance of other economies. However, the economy’s overall performance improves in absolute terms by +0.3 points. One of the dimensions where India increases parity is in Economic Participation and Opportunity, where its score improves by +.9 percentage points to 40.7%. While most indicator values remain the same, parity in estimated earned income rises from 28.6% to 29.9%, positively impacting the subindex score. Scores in labour-force participation rate remains the same (45.9%), duplicating India’s highest level achieved to date. In Educational Attainment, India scores 97.1%, reflecting positive shifts in female shares for literacy and tertiary education enrolment, which result in positive score improvements for the subindex as a whole. India also records higher parity in Health and Survival, driven by improved scores in sex ratio at birth and in healthy life expectancy. However, similar to other countries, parity in the latter is obtained despite an overall reduction in men’s and women’s life expectancy. Where India records a slight drop in parity (-0.6 points) since the last edition is in Political Empowerment. Female representation in parliament falls from 14.7% to 13.8% in 2025, lowering the indicator score for the second year in a row below 2023 levels. Similarly, the share of women in ministerial roles falls from 6.5% to 5.6%, moving the indicator score (5.9%) further away this year from its highest level (30%, 2019).
Indonesia
Indonesia ranks 97th in 2025, climbing three positions compared to 2024. Its overall gender parity score increases from 68.6% to 69.2% over the same period. While some of the year-on-year variation is linked to data availability, particularly in women’s representation in parliament, long-term trends show more consistent progress. Since 2006, Indonesia has closed 5.2 percentage points of its political gender gap, driven by a steady increase in women’s parliamentary representation, alongside some gains in ministerial positions. However, women’s representation in ministerial roles has declined in recent years, though it remains above 2006 levels. In the Economic Participation and Opportunity subindex, Indonesia has seen gradual progress, with a notable increase in women’s representation in senior roles. Between 2006 and 2025, the gender parity score for legislators, senior officials and managers rises from 20.5% to 49.4%. In the Educational Attainment subindex, women are steadily catching up to men across all education levels. This is particularly evident in tertiary education, where the score improves from 79.4% in 2006 to a point where women are now more likely than men to enrol. In the Health and Survival subindex, Indonesia has maintained a near-parity score, with only a minor decrease in the females-to-males ratio at birth – from 0.944 in 2006 to 0.943 in 2025 – representing a -0.1 percentage-point change over the period.
Japan
Retaining the same rank as in the 2024 edition (118th), Japan shows a slight improvement (+0.3 points) in overall gender parity score (66.6%) compared to last year. This result puts Japan on track to reach and surpass its highest score to date, 67%, recorded in 2015. Across nearly every subindex, Japan has increased parity since 2024. Most notably, it is in Economic Participation and Opportunity where Japan records the most progress, raising its score from 56.8% to 61.3%. The shift is boosted by increased rates of women participating in the labour force (from 54.8% to 55.6%), higher representation of women in the senior officials, managers and legislators category (from 14.6% to 16.1%), as well as increased parity in estimated earned income (59.2%, up from 58.3%). In Educational Attainment, results remain virtually static. Parity in tertiary education enrolment increases alongside female rates in the category – but not enough to close the gap just yet. There are no significant changes in Health and Survival, as parity ratios prevail despite updates to indicator values. Where Japan’s performance decreases is in Political Empowerment, from 11.8% in 2024 to 8.5% in 2025. The regression stems from a reduction in women’s ministerial representation, from 25% to 10%, and places Japan back on prior and lower levels of performance after recording its highest-ever political parity score in 2024.
Mexico
Mexico climbs 10 positions to rank 23rd globally and rises two spots to 5th in Latin American and the Caribbean. The economy has shown consistent progress over time, with its overall parity score increasing from 64.6% in 2006 to 77.6% in 2025. This clear upward trajectory is primarily driven by improvements in economic and political gender parity. In Economic Participation and Opportunity, Mexico’s parity score rises from 48.0% in 2006 to 60.9% in 2025. However, this year’s performance reflects a slight decline of 0.3 percentage points from the previous year, due mainly to a drop in the perceived wage equality score – from 52.2% in 2024 to 51.3% in 2025. While Mexico has caught up with the global average in economic parity (61.0%), it still lags behind the regional average of 65.6. In Political Empowerment, Mexico has demonstrated outstanding performance in women’s representation in both parliamentary and ministerial positions. The economy has maintained full gender parity in parliament since 2022 and, for the first time in 2025, has closed more than 80% of the gender gap in ministerial roles. With the election of Claudia Sheinbaum Pardo as Mexico’s first female president in late 2024, Mexico has now closed over half of its political gender gap. Across the Educational Attainment and Health and Survival subindexes, Mexico has consistently maintained near-full gender parity over time.
Nigeria
Trending towards having a majority male population, Nigeria ranks 124th in 2025, having closed 64.9% of its overall gender gap yet losing one rank and –1.0 percentage points in score compared to last year’s edition of the index. Nigeria records improved scores in Economic Participation and Opportunity, registering a +3.6-point improvement from last year. Across economic parity indicators, there are positive developments – most notably, parity in labour-force participation rises from 89.9% to 95.6% after female participation grew to its highest recorded levels, and income parity increases from 50.1% to 60.4% after female income resumes an upward slope after a four-year slump. These developments place Nigeria on an encouraging trajectory for workforce parity; however, Nigeria’s performance fails to advance in the other three subindexes, with the most significant regression occurring in Political Empowerment (-2.9 points) due to diminished representation of women in ministerial positions, which declines from 17.6% in 2024 to 8.8% in 2025. In Educational Attainment, while literacy rates increase overall for both men and women, male rates (73.7%) grew higher than women’s (53.3%), increasing the gender disparity as a consequence. Unlike in many other economies, healthy life expectancy improves in Nigeria for both men and women, although more so for men, thereby diminishing gender parity in this indicator.
Pakistan
Occupying the bottom rank of the index (148), Pakistan sees its overall parity score decline from last year’s edition, from 57% to 56.7%. Overall Pakistan has closed +2.3 of its gender gap since 2006. However, this year’s results are a second consecutive drop from the economy’s best score of 57.7%, achieved in 2023. Parity in Economic Participation and Opportunity declines by –1.3 percentage points. While economic representation indicators have remained unchanged, income disparity in Pakistan has slightly increased since the last edition (+.02 points), as has perceived wage inequality (+4 percentage points). The sole subindex advance registered by Pakistan in this year’s edition is Educational Attainment, bumping educational parity upwards by +1.5 percentage points to reach 85.1%. Part of the shift is driven by an increase in female literacy rates (from 46.5% to 48.5%). However, parity has also risen because male enrolment shares have dropped in tertiary education, increasing the relative balance between men and women but lowering educational reach overall. The Southern Asian economy sees political parity drop from 12.2% in 2024 to 11% in 2025. While parity in parliament increases by +1.2 percentage points, women’s ministerial representation drops from 5.9% in 2024 to zero in 2025 – and with it the overall subindex score.
Philippines
The Philippines ranks 20th in 2025 with an overall score of 78.1%. Compared to the previous year, the economy has climbed five positions in the ranking, with a 0.2 percentage-point increase in its overall gender parity score. Regionally, the Philippines retains its 3rd position in the Eastern Asia and the Pacific block, behind New Zealand and Australia, as it did last year. In the Economic Participation and Opportunity subindex, the Philippines has maintained a parity level of around 80% for years. In 2025, slight improvements in the scores for wage equality and estimated earned income have brought its economic parity score to 79%, the highest in Eastern Asia and the Pacific this year. Despite strong performances in Educational Attainment, the gender parity in education has slightly declined. For the first time, the primary school net enrolment rate for boys surpasses that of girls, resulting in a 1.2 percentage-point drop in the education parity score from previous years of full parity. In Health and Survival, the Philippines has faced growing sex imbalances at birth over the past decade. The sex ratio at birth (females to males) has declined from 0.944 in 2016 to 0.926 in 2025. In Political Empowerment, the Philippines’s political parity score is buoyed by nearly 16 years of female leadership under Presidents Corazon Aquino and Gloria Macapagal-Arroyo. This contributes to a 46.2% score in the head-of-state indicator, the secondhighest in the region. However, progress in female representation in parliament remains modest, with the score at 38.9%. The score for ministerial positions has declined to 21.1% in 2025, down from over 30% in both 2006-2007 and 2023.
United States of America
The United States of America ranks 42nd, moving up one position compared to 2024. The economy has closed an additional one percentage point of its overall gender gap, reaching 75.6% parity in this edition. This improvement is primarily driven by increased representation of women in ministerial positions: on January 1, 2025, women held 40.0% of such roles, up from 33.3% in January 2024. In the Economic Participation and Opportunity subindex, the United States continues to score slightly above 75%, a level it has maintained for several years. However, there are masks underlying shifts: an increase in the share of women in senior leadership positions contrasts with a decline in estimated earned income. In 2025, the gender parity score for legislators, senior officials and managers has risen to 75%, returning to levels seen in the mid-2010s. Conversely,the score for estimated earned income has dropped to 63.3%, its lowest since 2010. Regarding the Health and Survival subindex, the United States has seen a marginal improvement of 1 percentage point in the healthy life expectancy score compared to 2024, while the females-to-males birth ratio remains unchanged. In the Educational Attainment subindex, the economy has achieved parity. Women now outnumber men in enrolment at all levels of education, a trend especially pronounced at the tertiary level, where the gap in favour of women continues to widen.
Viet Nam
Viet Nam ranks 74th globally, climbing two spots compared to last year. At the regional level, it has been overtaken by Mongolia and now ranks 7th in Eastern Asia and the Pacific. To date, Viet Nam has closed 71.3% of its overall gender gap, reflecting a generally upward trend despite some fluctuations over time. In the Economic Participation and Opportunity subindex, Viet Nam has closed 75.9% of its gender gap, a level it has maintained since the early 2020s. Notably, the economy has seen improvement in its labour-force participation parity for the first time since the COVID-19 downturn, rebounding to 88.6% this year. However, this still falls short of the pre-COVID level of around 92.0%. In the Educational Attainment subindex, Viet Nam has closed 97.2% of its gender gap this year and continues its efforts to narrow gender disparities in lower levels of education. Available data shows that from 2007 to 2025, the literacy gap has narrowed by 5.4 percentage points, and the gender gap in primary school enrolment has decreased by 2.8 percentage points, with improvements seen for both men and women. In Health and Survival, while women continue to outlive men in terms of healthy life expectancy, sex imbalances at birth have worsened over time. The female-to-male ratio at birth declined from 0.935 in 2007 to 0.900 in 2025, pushing Viet Nam’s score in this subindex to the second lowest in the region. In Political Empowerment, there has been marginal progress, with a 0.5 percentage-point increase in women’s representation in parliament compared to last year. Viet Nam’s overall political parity score remains unchanged relative to its regional peers.
Speed of progress
The Global Gender Gap Report is the longeststanding index for gender parity, offering a unique overview of national, regional and global evolution across the four dimensions measured by the index. With a time series spanning 19 editions, the report can trace the extent of progress achieved to date by a group of 100 economies that have been featured in the index since 2006.
In this exploration, the report finds that in just under two decades, 99 of these 100 economies have improved their overall gender parity scores – gaining an average 6 percentage points from their initial baseline score. Figure 1.10 illustrates that while both the higher-performing and lower-performing economies have remained relatively stable, those in between show more dynamic trajectories.
The heatmap illustrates the numerous fluctuations experienced by economies over the past 19 years. While most economies have achieved overall upward trajectories, the trajectories have not been consistent across economies. Economies like Bangladesh, Iceland, United Arab Emirates, Chile, Ecuador and Mexico have improved their scores the most over the 19 editions, while North Macedonia, Iran (Islamic Republic of), Sweden, Kazakhstan, and Lesotho display the lowest total gains over time. Within the latter group, Sri Lanka is the sole economy to have regressed from its 2006 baseline (-7.4 percentage points).
This suggests that collective and coordinated progress has been possible under a global consensus to achieve gender equality by 2030. As a result, gender parity has increased by +4.8 percentage points since 2006, and access to economic and political opportunity has expanded over time. Gender parity has risen significantly in the world’s senior economic leadership (+17.5 percentage points), in higher education (+16.1 percentage points), in governing cabinets (+12.6 percentage points) and in legislative bodies (+14.7 percentage points).
However, economies have been following and continue to follow different trajectories towards global parity. Not every advance has been sustainable over time, and the pace at which economies move can be affected by numerous externalities. To assess the speed of change that economies have experienced over the past 19 editions, the report groups economies with similar rates of advancement, as illustrated in Table 1.5, and analyses their evolution in terms of trends.


Economies in the fastest-moving group include Bangladesh, Chile, Ecuador, Ethiopia, Nicaragua, Mexico, Saudi Arabia and United Arab Emirates. Latin America and the Caribbean has the greatest regional representation in this block at 50%, followed by Middle East and Northern Africa, at 25%.
Closely behind are 15 economies moving at the second-fastest rate. Nearly half (46.7%) of the group comes from Europe, with representative contingents from Latin America and the Caribbean (20%) and Sub-Saharan Africa (13.3%) Bahrain is the sole member of this group from the Middle East and Northern Africa.
Moving at “medium” speed is the largest group, comprised of 42 economies. The group is dominated by European economies (43%), followed by Latin America and the Caribbean economies (21.4%). The two economies from Northern America are also in this group, while from Southern Asia only India features. At a slower speed, but still making progress, are 30 economies that follow next that include a mix of economies from Sub-Saharan Africa and Europe (at 26.6%) followed by Eastern Asia and the Pacific (23.3%). Next are the four economies that are at a relative “standstill”. This group includes Kazakhstan, Iran, Sweden and North Macedonia. Finally, there is one economy with a negative rate of advancement: Sri Lanka.
Analysing the table in Figure 1.11 from an income perspective shows that 75% of economies that have been constantly represented in the index since 2006 fall into the high- or upper-middle income categories, as illustrated by figure 1.11. Only six economies in the sample belong to the low-income category and 19 are lower-middle income. This is more representative of income as an enabling factor for data availability and continuity, rather than as a condition for performance or speed – evidenced by the fact that 41% of the sample advances at medium speed, regardless of income level. In every income group are economies that break away from the pack and are able to maintain a faster pace of change.
Figure 1.12 illustrates how speed of progress reflects differently across the different dimensions of the index, with more dynamic changes in the Economic Participation and Opportunity and Political Empowerment subindexes.
In Economic Participation and Opportunity, the fastest group had lower benchmark performances to start from compared to other groups but recorded positive trajectories that reduced their standing distance from 15 to 6 percentage points over time. The second group had the secondlowest departure point in 2006, yet has surpassed all other speed groups to occupy the highest position in the index in 2025. The standstill group has seen their trajectory tilt downwards over time, which negatively impacts their speed of change.


In Political Empowerment, it is the fastest group that has made the most progress, displaying an upwards trajectory starting from the lowest average score to the highest in 2025. The second group follows closely behind, with an initial jump in 2014, after which it has climbed progressively upwards. The fourth group has the flattest progression trajectory, devolving from the second-lowest to the lowest average score over 19 editions. The standstill group, in contrast, recovered from an early drop in scores, then sees its trajectory shift negatively compared to last year’s edition.
Although Educational Attainment and Health and Survival display high levels of fluctuation over time, there are changes within the space of a decile. All speed groups have managed to improve their educational parity scores over time. However, only the first group has overtaken other groups across editions, boosting their performance and speed of progress. The fifth group has seen the most fluctuation, having to recover twice from downturns in 2011 and 2021. In terms of health parity, most groups have seen their performance decline over time; only the second group has improved its average score since 2021.


