Fostering Effective Energy Transition 2025


Sub-index and dimension trends
Equity rebounded, sustainability held steady, security stagnated and transition readiness slowed, highlighting uneven progress across energy systems.
3.1 System performance
System performance key takeaways
- Energy system performance rebounded. 2025 saw improvements in security, equity and sustainability – signalling improved delivery after years of stagnation.
- Price shifts and clean energy adoption enabled gains. On average, lower energy prices and subsidy reforms and greater rural access supported equity, while reduced energy and emission intensity and increased use of clean energy drove sustainability gains.
- Structural weaknesses persisted. Import dependence, low grid flexibility and uneven infrastructure progress continued to expose systems to disruption.
- Progress faces rising headwinds. Trade frictions, supply chain risks and policy uncertainty could stall momentum and deepen regional gaps.
System performance measures how well a country’s energy system delivers on the three key dimensions: equity, security and sustainability (Figure 5).
Over the last 10 years, system performance improved by 3.3%. Despite recent fluctuations driven by the COVID-19 pandemic, over the past decade, the energy system strengthened across all three underlying dimensions:
- Equity scores fluctuated slightly but ended up with only a marginal net increase (+1.5% from 65.1 in 2016 to 66.1 in 2025), highlighting ongoing equity challenges in many countries.
- Security scores improved slowly but consistently (+3.4% from 65.3 in 2016 to 67.5 this year), indicating that diversification and supply reliability remain high priorities but are difficult to advance quickly.
- Sustainability scores saw the strongest upward trend (+5.3%), driven by cleaner energy mixes and decreased energy and carbon intensity. Despite these gains, sustainability remained the lowest-scoring dimension, highlighting the long path ahead to climate-aligned energy systems.
Figure 5: Global average system performance and component performance, 2016-2025


Security
Energy security – the continuous availability of energy sources at a reasonable price – is a cornerstone of economic resilience and societal stability. Today, it requires not only reliability and diversification but also flexibility in order to manage volatility through demand responsiveness, interconnections and variable renewables. As digital systems like smart grids and AI-driven infrastructure expand, cyber resilience is also emerging as a critical dimension of energy security. The International Energy Agency (IEA)/UK Government Summit on the Future of Energy Security37 reinforced this view, emphasizing the need for resilience, supply chain diversification and international cooperation. The summit’s outcomes have been influential in shaping global energy security discussions and refreshing frameworks for energy security. The ETI’s security dimension evaluates the reliability and resilience of energy systems.
Security over the past 10 years
Over the past decade, the security dimension saw modest improvement of 3.4%, marked by slow but steady progress in diversification and grid resilience, and reduced exposure to supply risks (Figure 6).
- Between 2016 and 2020, security scores improved gradually, supported by moderate gains in electricity diversification and reductions in technical transmission and distribution losses.
- In 2021-2023, progress stalled as the COVID-19 pandemic – combined with geopolitical instability, supply chain disruptions and rising energy demand – placed renewed pressure on energy systems.
- In 2024-2025, scores recovered slightly by 0.4%, driven by a reduction in import dependence and greater diversification of energy sources, as well as continued investments in renewables and regional interconnections.
Despite the long-term improvement, key sub-indicators revealed underlying fragilities:
- Average energy import dependence scores declined in 2024 but rose again in 2025 (+1.9% y-o-y).
- Score of power system flexibility deteriorated (-1.3% y-o-y in 2025), suggesting that capacity to respond to demand shocks and variable supply was still insufficient.
Figure 6: Security dimension trend, 2016-2025


Security scores in 2025
Energy security scores improved slightly in 2025 (+0.4%) but remained the slowest-moving system performance dimension. Modest gains in electricity diversification (+0.8%) and grid integration were offset by declining system flexibility (-1.3%). Grid resilience was found to be under strain, particularly in fast-growing or import-reliant economies.
Regional divergence
Energy security dynamics varied significantly across regions, shaped by different energy mixes, import dependencies, diversification levels and levels of system resilience. While many advanced economies were found to be investing in digital grids and regional links, others faced setbacks from infrastructure gaps and external shocks. The recent large-scale blackouts in Spain and Portugal underscore that even developed markets remain vulnerable to grid instability. Without focused investment in storage, transmission and energy trade, the security gap may continue to grow. In 2025, regional energy security trends were shaped by changing import dynamics, infrastructure reliability and resilience investments (Table 5).
Table 5: Security dimension regional overview, 2016-2025
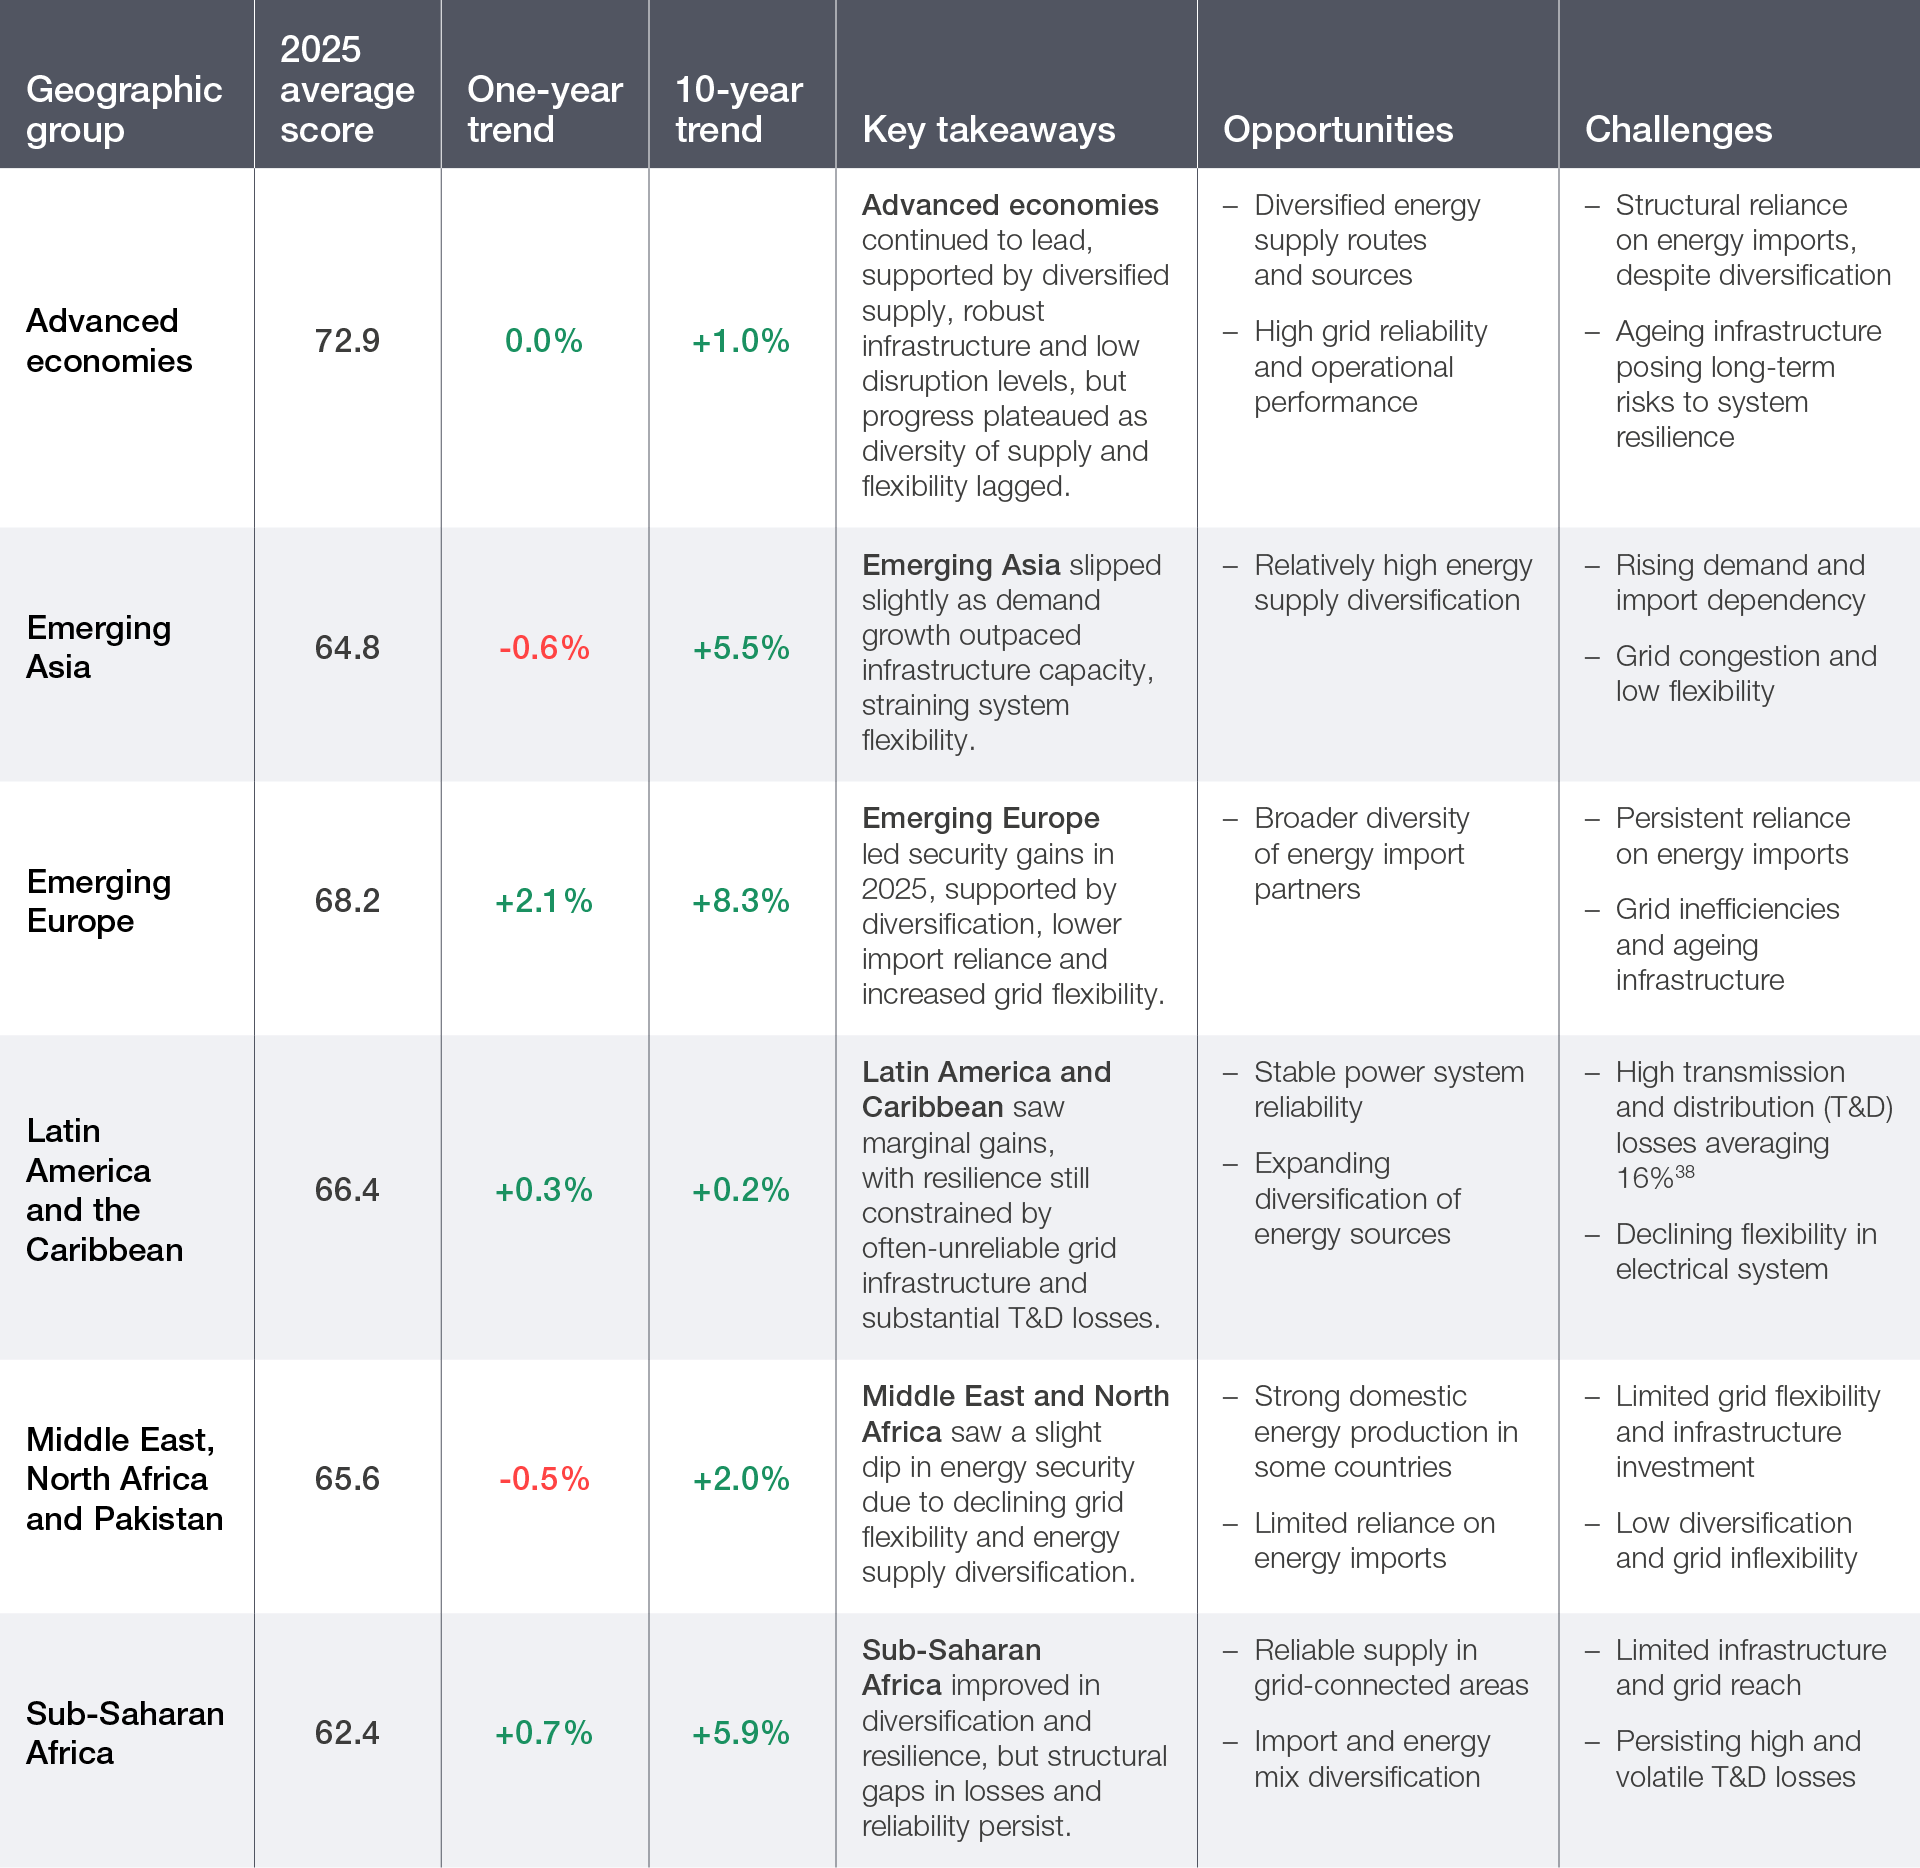

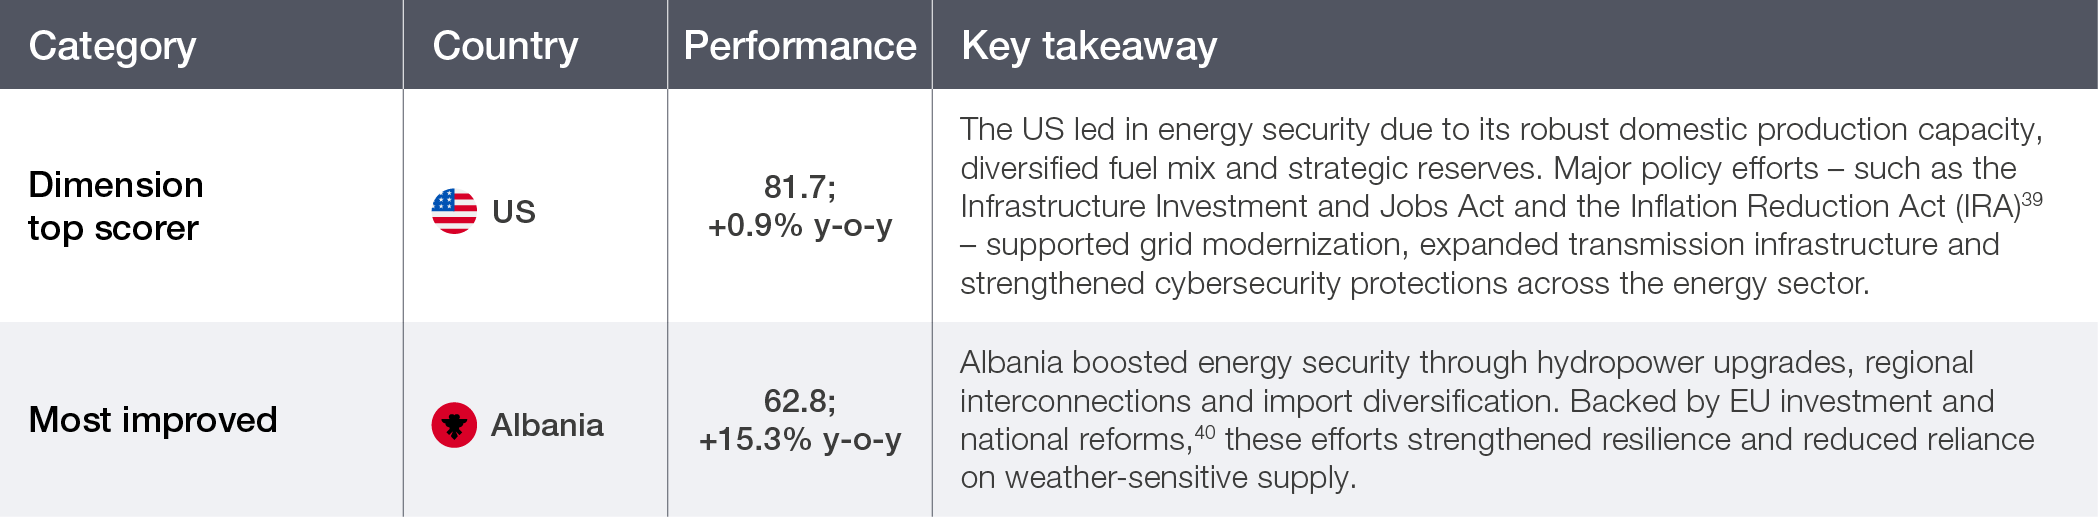
Table 6: Security frontrunners 2025

Looking ahead: reinforcing security through resilience and flexibility
Energy security will remain a central priority amid rising trade frictions, shifting alliances and surging digital demand. The rapid expansion of AI-driven data centres is straining grids and increasing power demand – potentially crowding out clean energy investments. In this context, security will increasingly depend not just on fuel or technology diversity, but on a system’s adaptive capacity (i.e. its ability to absorb shocks and respond to disruptions).
To build resilience, countries must invest in flexible infrastructure, localized manufacturing and regional cooperation while ensuring access to critical technologies and materials. Future gains will depend on:
- Modernizing and expanding grid infrastructure to support variable generation and system flexibility (e.g. storage, responsive demand)
- Strengthening transmission and distribution systems and interconnectivity
- Enhancing supply resilience through regional cooperation and resource diversification
Equity
Achieving an equitable energy transition is critical for sustainable socioeconomic growth. To realize this, it’s crucial to secure affordable, reliable and clean energy access for all while ensuring that benefits and costs are fairly distributed.
The ETI’s equity dimension assesses energy system performance in terms of access, affordability and its role in economic development.
Equity over the past 10 years
Over the past 10 years, the equity dimension saw a modest net improvement of 1.5%, with a mixed performance across the decade (Figure 7):
- Between 2016 and 2021, equity improved gradually, reaching its peak in 2021, driven by expanded access to electricity and clean cooking technologies.
- This was followed by a decline from 2022 to 2024 caused by global energy price shocks and inflationary pressures, which pushed equity scores downwards.
- In 2025, scores rebounded by 2.2%, reflecting easing energy prices and improved affordability, although equity remained slightly below the 2021 high.
Despite the recent recovery, the underlying indicators revealed persistent challenges:
- Energy prices (household and industrial) showed high volatility, limiting long-term equity gains.
- Gains in clean energy access continue, but are incremental rather than transformational.
Figure 7: Equity dimension trend, 2016-2025


Equity scores in 2025
The equity dimension recorded its strongest annual score improvement in the past decade in 2025 (+2.2%), driven by falling gas prices, reduced subsidies, greater energy self-sufficiency and tech-enabled efficiency gains. Future progress hinges on grid reliability, pricing reforms and low-carbon technology exports more than new connections, although some countries and regions still have major energy access challenges.
Rural access scores improved by 0.4%, yet regions like Sub-Saharan Africa and South Asia continued to face major infrastructure and equity barriers, slowing momentum towards Sustainable Development Goal (SDG) 7.1, which calls for universal access to affordable, reliable and modern energy services.41 Clean cooking fuel access scores rose (+0.5%) as biomass reliance declined – improving health outcomes in rural areas. Yet, scaling this transition requires more than infrastructure. Social inclusion, consumer awareness and financing tools are essential to sustaining progress.
Energy prices exhibited notable fluctuations – average scores for household electricity costs rose by 0.5%, while industrial prices increased by 2.6%, indicating declining costs. The US experienced significant drops in wholesale prices due to greater reliance on renewables and energy storage,42 while European prices reached a three-year low.43
Regional divergence
Energy equity continued to evolve unevenly across regions, shaped by varying levels of access, pricing structures, subsidy policies and external cost pressures. While most regions achieved high levels of urban electrification over the past decade, rural access and equity remained major differentiators. In 2025, some regions saw improvements in equity linked to reform-driven subsidy reductions while others benefited from improved domestic supply and investment (Table 7).
Table 7: Equity dimension regional overview, 2016-2025


Table 8: Equity frontrunners 2025


Looking ahead: balancing short-term relief with long-term equity
Looking ahead, energy equity must shift from a moral imperative to a strategic priority – especially in regions with persistent poverty and weak infrastructure. As energy systems evolve, gaps in access and affordability could widen, particularly for rural and low-income communities.
While lower fuel prices offer short-term relief, they may delay critical reforms like subsidy phase-outs and targeted electrification. Meanwhile, rising trade barriers are pushing up clean technology costs, threatening progress in price-sensitive markets. To make equity a driver of long-term inclusion and competitiveness, policies must focus on:
- Expanding access in underserved and rural regions through grid and off-grid innovation
- Aligning energy affordability with subsidy phase-out to protect the vulnerable without distorting long-term signals
- Positioning affordable energy costs as an economic enabler for industry, jobs and national competitiveness
Sustainability
Delivering long-term energy security and climate resilience hinges on the ability of energy systems to decouple growth from environmental degradation. A truly sustainable energy transition prioritizes low-emission, resource-efficient pathways that protect ecosystems, minimize pollution and support global net-zero goals.
The ETI’s sustainability dimension evaluates system performance in terms of energy efficiency, emissions intensity, environmental impact and the share of clean energy sources in the overall energy mix.
Sustainability over the past 10 years
Over the past decade, the sustainability dimension was the strongest and most consistent of the three system performance components, with a steady but incremental upward trend (Figure 8). Clean electricity reached 49% of global generation in 2023,51 signalling meaningful progress towards the 90% target needed by 2050 for net zero.52 This momentum in the power sector contrasted with lagging progress across other parts of the energy system. Overall, the world remained off-track for 1.5-2.0°C pathways, and rising global temperatures underscored the urgency of more systemic and accelerated action to bend the emissions curve.
- From 2016 to 2022, sustainability scores improved gradually, driven by gains in energy efficiency, modest emissions intensity reductions and a rising share of clean energy sources in the energy mix.
- In 2023, a temporary reversal in progress occurred, as economic and industrial activity rebounded after disruptions related to the COVID-19 pandemic, prompting many countries to prioritize energy security and equity, which in turn led to increased fossil fuel use in some regions.
- In 2024-2025, scores resumed their upward path. For instance, a 1.2% gain was seen in 2025, supported by a rebound in renewable energy deployment and reduced emissions intensity in several large economies.
Despite this improvement, long-term structural challenges persisted:
- Despite a growth in average global scores of 15.8% over the decade, the average share of clean energy in the primary energy mix across ETI countries remained just 14.8% – highlighting slow progress in the decarbonization of heating, transport and industry.
- Energy efficiency progress was uneven. Average global energy intensity scores improved by nearly 8% over the decade, but momentum slowed. IEA reported a drop in improvement to 1.3% in 2023 from 2% in 2022 (far below the 4% annual improvement needed to meet net-zero targets).
Figure 8: Sustainability dimension trend, 2016-2025


Sustainability scores in 2025
In 2025, the sustainability dimension advanced modestly, with a 1.2% gain marking a continued upward trend. The improvement was driven by incremental gains in energy intensity and a steady rise in the share of clean energy within the total primary energy mix (+3.1%). Global emissions intensity also improved slightly (+1.6%), reflecting gradual shifts to cleaner fuel mixes and technological upgrades.
Some regions struggled to maintain momentum due to weak policy enforcement, rising industrial energy demand and limited access to clean energy finance. While CH4 management and renewable adoption advanced in parts of Asia and Latin America, other regions saw stagnation or minor regressions.
On average, the share of clean energy in the primary energy mix for ranked countries reached 14.8% in 2025, up from 14.4% in 2024 – a positive trajectory, though still far from levels needed to align with long-term climate goals. In particular, clean electricity generation (from renewables and nuclear) rose to 49% of global power generation, an encouraging milestone on the path towards the 90% clean power share needed to reach net zero by 2050. This progress was underpinned by record-breaking growth in installed renewable capacity – with 585 gigawatts (GW) added in 2024 – a 15.1% y-o-y increase and the fastest expansion on record. Renewables accounted for 92.5% of all new power capacity additions, driven largely by solar and wind alongside steady contributions from hydropower and a modest nuclear rebound.55
Regional divergence
Regional sustainability outcomes revealed that, while some regions made steady gains, others continued to face rising energy intensity, stagnant clean energy shares or slow emissions reductions.
Table 9: Sustainability dimension regional overview, 2016-2025


Table 10: Sustainability frontrunners 2025


Looking ahead: preserving sustainability amid supply chain strains
As trade tensions intensify, sustainability progress faces new headwinds. The tariffs imposed by the US on imports from China are affecting clean energy technologies – and subsequent retaliatory measures – and fracturing global clean technology supply chains. This may raise costs and delay access to critical technologies in markets affected by trade barriers.
To sustain momentum in this new context, countries can focus on:
- Doubling down on energy efficiency through industrial process upgrades, vehicle standards and targeted building retrofits
- Accelerating clean electrification, grid integration and energy storage to absorb rising renewable supply
- Scaling new technology solutions for hard-to-abate sectors such as heavy industry and transport, including hydrogen, carbon capture, utilization and storage (CCUS) and next-generation nuclear energy
- Localizing and diversifying clean energy value chains to reduce import dependence while still harnessing trade strategically to manage costs
- Integrating decarbonization with industrial resilience and economic competitiveness – building systems that are clean, competitive and geopolitically agile
Those who integrate decarbonization with industrial resilience – building systems that are clean, competitive and geopolitically agile – will lead.
3.2 Transition readiness
Transition readiness key takeaways
- Readiness as the driver of progress: Transition readiness remained the main engine of ETI progress, growing 12.5% since 2016 (versus 3.3% for system performance).
- Broad gains, uneven foundations: Regulation, infrastructure and investment advanced most, but education and innovation continued to act as bottlenecks limiting the depth of readiness.
- Momentum under pressure: Progress slowed to +0.8% in 2025 as macroeconomic, trade and fiscal pressures strained finance and innovation enablers.
- A clear differentiator: Readiness increasingly separates leaders from laggards. Advanced economies lead, and emerging Asia is catching up via investment and infrastructure.
The ETI’s transition readiness sub-index is rooted in various factors that are important for enabling the transition, including the stability of the policy environment, the level of political commitment, the investment climate, access to capital, consumer engagement, and the development and adoption of new technologies. These elements collectively shape a country’s ability to steer its energy transition effectively. While some factors, such as skills or the quality of transport infrastructure, extend beyond the energy system, they significantly influence the trajectory and success of the energy transition and are explicitly acknowledged as part of the sub-index.
Transition readiness over the past 10 years
Over the past decade, transition readiness has been the main engine of ETI progress. Starting from a lower base (41.8 in 2016), it rose by 12.5% to reach 47.1 in 2025, reflecting steady gains in regulation, infrastructure and institutional maturity. In contrast, system performance began at a higher baseline (61.5 in 2016) and grew more modestly to 63.5 (+3.3%), due to the slower evolution of mature dimensions like equity, security and sustainability. Transition readiness is now emerging as the key foundation for future success in energy systems.
Some key takeaways include:
- Regulation and political commitment saw the sharpest increase (+19.6%), a sign of strengthening policy frameworks and long-term planning in many countries.
- Infrastructure steadily improved by 15.4%, highlighting ongoing efforts to modernize grids and energy systems.
- Education and human capital experienced a more gradual rise (+6.8%), though with some volatility in recent years, pointing to structural constraints in workforce development (particularly aligning talent pipelines with emerging clean energy and digital skills demands).
- Innovation showed the least improvement over the past decade (+3.4%). While some countries recorded isolated gains in environment-related research and development (R&D) and technology diffusion, the overall trend highlights the urgency of establishing more targeted and scaled innovation policies to accelerate transition outcomes.
- Finance and investments showed late but notable improvement (+10.3%), indicating growing clean energy capital flows. Yet, investment levels still lagged behind what’s required to meet future system needs, suggesting that risk mitigation and bankability are still barriers in many markets.
Figure 9: Global average transition readiness component performance, 2016-2025


Transition readiness scores in 2025
In 2025, the transition readiness dimension improved by a moderate 0.8%, which is less than its 10-year average of 1.2% and notably slower than system performance, which outpaced readiness growth for the first time in recent years.
Regulation and political commitment scores saw some progress (+0.6%), supported by advances in energy efficiency and renewable energy policies. This momentum, however, was partially offset by setbacks in the effective pricing of carbon emissions – including reductions in excise taxes, carbon taxes and/or tradeable permit coverage. Sustaining long-term credibility will require stronger implementation capacity and greater cross-sectoral alignment.
Infrastructure advanced steadily (+1.5%), supported by investment in renewable integration and transport infrastructure development – particularly in advanced economies and emerging Europe. Yet, rollout gaps remained in emerging economies, limiting scalability. Renewable energy was a main driver, and solar energy experienced remarkable growth, reaching over 2.2 terawatts (TW) in 2024 (up from 1.6 TW in 2023). This growth marked a record year for photovoltaic (PV) deployment.61 Wind power also saw substantial progress (with 117 GW installed in 2024), advancing into new geographies and solidifying its role as a core pillar of the global energy transition.62 Nuclear power continued its upward trajectory – global capacity reached 371.5 GW by the end of 2023, supported by new reactors in Asia.63 Hydropower reached 1,412 GW globally in 2023, but investment was found to be lagging, putting the goal of hitting net-zero targets by 2050 at risk.64
Education and human capital scores improved modestly (+2.8%) since 2024, driven by improved access to clean energy jobs. Yet, persistent skill gaps and weak talent ecosystems continue to limit broader workforce readiness and global talent competitiveness.
Innovation remained flat (-0.1%), signalling stagnation in innovation ecosystems and R&D spending. Despite isolated advances in clean technology entrepreneurship, the global clean energy innovation pipeline appeared to be losing momentum.
Finance and investments scores showed slow gains (+0.2%), with average clean energy investment experiencing reduced growth after rapid recent gains. Moreover, financing conditions and access to credit in emerging economies remained constrained by risk perceptions and limited public-private mechanisms for reducing capital costs.
Overall, while 2025 sustained the positive trajectory of transition readiness, unlocking further progress will require sharper focus on innovation, skills and capital enablement – especially in markets where ambition still outpaces deliverability.
Regional divergence
Transition readiness remained the clearest differentiator of long-term energy transition potential, shaped by each region’s institutional capacity, infrastructure, human capital, innovation ecosystem and investment attractiveness. While emerging Europe, emerging Asia, and the Middle East, North Africa and Pakistan regions improved over the past decade, the scale and speed of readiness gains varied considerably. In 2025, regulatory progress and clean technology investment were key drivers of improvement in several regions, while others faced headwinds in infrastructure delivery and talent retention (Table 11).
- Advanced economies saw a slight decline in transition readiness in 2025 (-0.4% y-o-y), driven by a drop in finance and investment conditions (-4.1% y-o-y) and continued stagnation in above-average innovation (despite gains in infrastructure and education, and sustained high regulatory performance).
- Emerging Asia recorded solid progress in 2025 (+5.0% y-o-y), driven by improvements in regulation and infrastructure, and, above all, a sharp rise in clean energy investment.
- Emerging Europe saw moderate progress in 2025 (+2.1% y-o-y), driven by gains in infrastructure and workforce, though regulation and innovation declined and structural gaps in investments persisted.
- Latin America and the Caribbean saw stagnation in transition readiness in 2025 (0% y-o-y), with modest improvements in infrastructure, innovation, human capital and regulation offset by declines in financial investments.
- Middle East, North Africa and Pakistan made modest progress in 2025 (+0.6% y-o-y), with improvements in regulation, education and human capital and financial investments offset by declines in innovation and infrastructure, highlighting persistent structural barriers.
- Sub-Saharan Africa saw no net gain in transition readiness in 2025 (0% y-o-y). Improvements in regulation and innovation were offset by setbacks in infrastructure and finance, pointing to an uneven and fragile readiness landscape.
Table 11: Regional transition readiness snapshot


Looking ahead: recalibrating readiness in a fragmented world
Due to trade tariffs and broader economic and geopolitical uncertainty, 2025 may mark a turning point for transition readiness. Clean energy finance may face diversion risks as governments shift priorities towards domestic industrial protection and inflation control. The looming threat of slower economic growth or recession in some countries could further tighten public budgets and private capital flows, delaying investments in energy innovation and clean energy growth.
Key vulnerabilities include:
- Financial investments: Higher trade barriers may raise costs for imported components, tightening margins and deterring investment in clean energy infrastructure and supply chains.
- Education and jobs: Economic slowdowns may stall re-skilling efforts and slow momentum in clean job creation – especially in emerging markets.
- Innovation: Budget reallocation towards short-term economic relief may undercut public R&D and crowd out long-term clean technology innovation.
- Digital infrastructure: Limited data systems and digital capabilities can hinder planning, grid optimization and transparency.
Yet, this phase also offers a chance for geopolitical and geoeconomic realignment. Countries can harness this moment to:
- Localize key segments of clean technology value chains.
- Strengthen industrial policy frameworks to align decarbonization with competitiveness.
- Diversify trade partnerships and deepen bilateral, regional and South-South cooperation. How countries respond now will shape their long-term competitiveness, supply chain security and ability to deliver on energy transition goals.
System performance and transition readiness are not sequential steps but parallel imperatives: one measures how effectively energy systems deliver today, while the other reflects a country’s ability to adapt, invest and scale solutions now and into the future. Both are essential to achieving an inclusive, resilient and sustainable transition.