Fostering Effective Energy Transition 2025


Overall results
The ETI signals a modest but broad-based recovery in energy transition progress – yet major questions remain about this trend’s durability.
2.1 Transition scores
Transition scores – key takeaways
- After several years of slow momentum, overall ETI scores in 2025 improved – +1.1% year-on-year (y-o-y) – by more than double the average rate of the past three years (+0.4%), reflecting the accelerating recovery in energy transition progress.
- Energy system performance improved. After recent declines, average system performance rose by 1.2% y-o-y in 2025 – returning to 2022 level.
- There was slower improvement in the enablers for the transition. In 2025, transition readiness rose by just 0.8% y-o-y – less than its 10-year average of 1.2% and notably slower than system performance, which outpaced readiness growth for the first time in recent years.
- Momentum is real – but its resilience remains uncertain. The 2025 rebound is encouraging, but fallout from recent geopolitical and economic shocks may still lie ahead, raising questions about the durability of recent gains and the strength of global energy systems.
Figure 2: Global average ETI and sub-index scores, 2016-2025


Energy system performance improved. After recent declines, average system performance scores rose by 1.2% y-o-y in 2025 – its fastest recovery in a decade – returning to 2022 levels. Much of this recovery was a result of greater equity dimension scores (+2.2% y-o-y), reflecting easing energy prices and structural subsidy reforms in many countries. Average sustainability scores also improved (+1.2% y-o-y), highlighting lower energy and emissions intensities and clean energy’s increased share of energy consumption. Nevertheless, global energy prices remained elevated. Meanwhile, system security average scores remained below recent levels, marginally improving in 2025 (+0.4% y-o-y), indicating persistent vulnerabilities in energy supply flexibility and diversity.
Progress on transition readiness slowed. In 2025, transition readiness rose by just 0.8% y-o-y, falling below its 10-year average of 1.2% and marking the first time since 2017 that system performance (+1.2%) outpaced preparedness. While past gains in regulation, infrastructure, innovation, education and investment have underpinned long-term progress, recent momentum has weakened. Regulatory frameworks, innovation ecosystems and investment capacity showed signs of stagnation, and, in some regions, a diminished rule of law further undermined policy effectiveness. This is relevant as improvements in readiness typically precede gains in performance. If readiness continues to lag, future progress in energy security, equity and sustainability could be at risk.
Figure 3: Global average ETI and sub-index growth rates, 2016-2025


Momentum is real – but exposed to disruption. While 2025 marked a strong rebound in ETI scores, underlying vulnerabilities persisted. The full economic and geopolitical impact of 2024 has yet to materialize – and may trigger second-order effects that stall or reverse progress. Rising tariffs, volatile capital markets and mounting fiscal pressures are already delaying infrastructure investment and increasing the cost of long-term financing. Public funds may be redirected to near-term economic stabilization, defence or social priorities – potentially crowding out investment in clean energy, innovation and grid resilience. These shifts risk widening transition gaps and weakening the durability of current gains.
This uncertainty is underscored by the developments that have shaped the energy landscape.
The global energy landscape, 2024-2025
The events of 2024 set the tone for a turbulent energy landscape in 2025. A confluence of geopolitical, economic and technological disruptions exposed key vulnerabilities in global systems – heightening the urgency of securing more resilient, adaptive energy strategies:
Geopolitical tensions intensified: Conflicts in key regions – including Europe, the Middle East and Africa – reinforced a global sense of fragility. State-based conflict was ranked as the top global risk in the World Economic Forum’s Global Risks Report 2025, reflecting a sharp rise in concerns around geopolitical fragmentation, proxy wars and terrorism.1
Conflicts over trade increased: Closely linked was the growing threat of geoeconomic confrontation, including the use of sanctions, tariffs and investment screening – now ranked as the third most pressing global risk, directly after extreme weather events.2
According to the World Economic Forum’s Global Risks Report 2025, the following factors are likely to present a material risk on a global scale in the year 2025 (see graph below).
World Economic Forum’s global risks factors


Global energy demand surged: Global energy demand surged by 2.2%, well above the decade’s average, driven by record electricity use caused by heatwaves, electrification3 and data centre growth. Most new demand was met by renewables and natural gas, deepening energy security risks for importers and boosting revenues for exporters.
CO2 emissions hit an all-time high: The emissions impact in 2024 – the hottest year on record4 – was also notable. Global energy-related CO2 emissions rose by 0.8% to 37.8 billion tonnes.5 While emissions continued to grow, the rate of increase slowed relative to previous years – even as the global economy expanded by 3%,6 and energy demand reached record levels (up 2.2%).
Energy prices eased but remain volatile: Prices declined from 2023 highs. This was largely driven by falling global energy commodity prices, although regional market factors led to diverging trends. However, in most regions, prices remained well above pre-COVID-19 pandemic levels, and underlying volatility persisted due to ongoing demand pressures and supply-side uncertainties.
Monetary dynamics constrained investments: While short-term rates fell, long-term capital remained expensive due to inflation and sovereign debt stress, especially in emerging markets.
Digital expansion reshaped energy consumption: The AI market size surged in 2024 (+35% y-o-y),7 and it’s projected that data centres will account for 10% of global power demand growth by 2030.8 While their aggregate impact is still moderate, energy demand from AI and data infrastructure is expected to be highly concentrated in certain countries – such as Ireland and parts of the US9 – underscoring the urgency of localized grid upgrades and clean energy expansion.
In 2025, investor confidence faces renewed pressures amid mounting global volatility. As of 21 May 2025 the US continues to enforce a 10% universal tariff10 alongside elevated “reciprocal” tariffs on 57 countries.11 Combined with an evolving global trade landscape and broader fragmentation, these measures are amplifying market uncertainty, reshaping supply chains and raising capital risk premiums. Capital markets remain highly sensitive to inflation, fiscal stress and geopolitical tensions – potentially slowing corporate capital expenditure (CapEx), delaying clean technology deployment and increasing the cost of capital for long-horizon energy investments. Higher input prices, increased investments in defence and trade disruptions are also forcing fiscal trade-offs, which may impact public investment in clean infrastructure, digital transformation and innovation. Reflecting this turbulence, in April 2025, the IMF revised its global growth forecast for 2025 from 3.3% down to 2.8%, with similarly muted expectations for the Eurozone (0.8%), underlining the weakening macroeconomic backdrop for energy transition investment.
This evolving landscape raises urgent questions about the resilience of energy systems – particularly energy security and the adaptability of policy frameworks. The following analysis of sub-index trends and country-level performance explores this in detail.
2.2 Country trends and regional insights
Country trends and regional insights – key takeaways
- The global energy transition is regaining momentum, but progress remains uneven. In 2025, 65% of countries improved their ETI scores, but only 28% advanced across all three dimensions – security, equity and sustainability – reinforcing the need to strengthen all sides of the energy triangle.
- Top performers remain stable, but new frontrunners are emerging. European countries dominated the top 10, but momentum is building elsewhere. China and the US improved their scores, while Latvia, Nigeria and the United Arab Emirates showed how targeted reforms can drive rapid progress.
- Readiness is key to lasting transition leadership. High performers outscored major economies by over seven points (with the largest gaps in human capital, infrastructure and regulation).
- The transition is multi-speed and shaped by local realities. Emerging Europe led in pace, emerging Asia in investment and Middle East, North Africa and Pakistan in equity – showing there’s no single path to progress.
Table 1 shows the overall rankings of countries in the 2025 ETI.12 While average global scores recovered from recent stagnation, the rankings highlight diverging country trajectories in both system performance and transition readiness. Some countries continue to consolidate their leadership through consistent policy commitment, clean energy investment and other measures, while others face setbacks due to either structural gaps or external shocks.
Table 1: ETI ranking table 2025

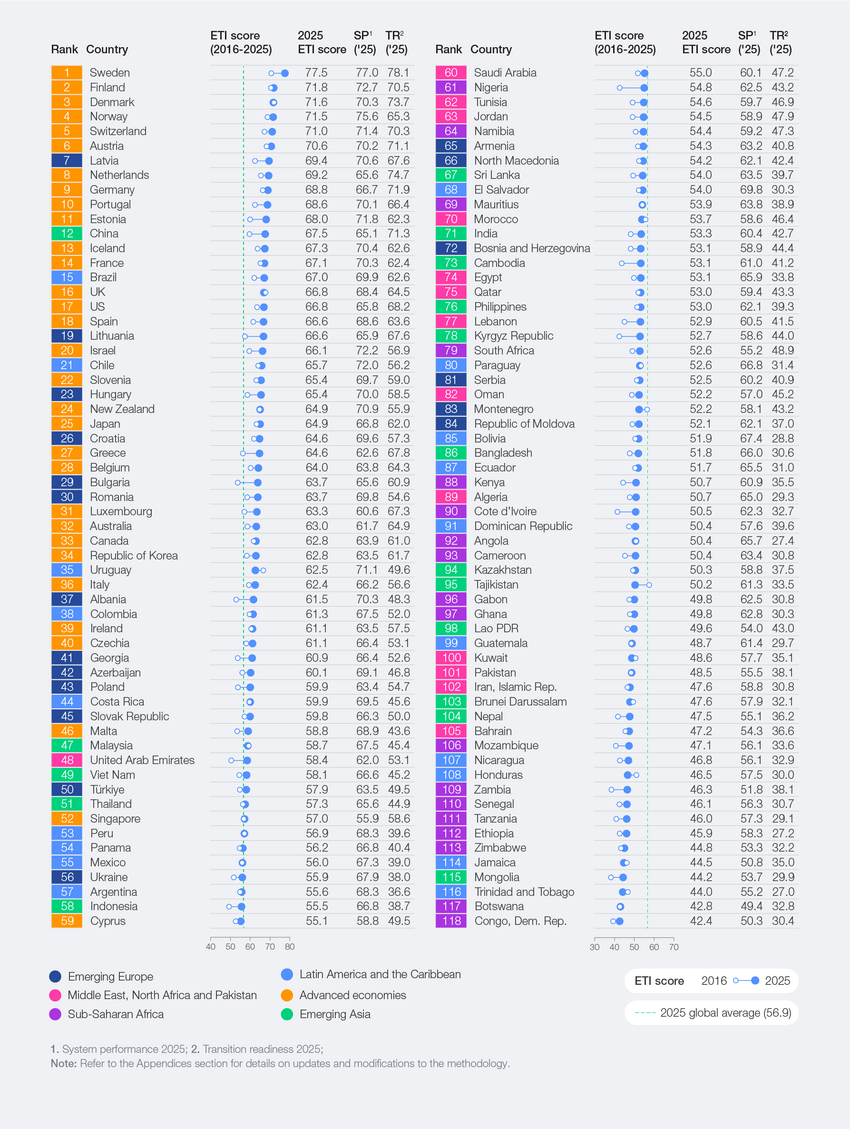
In 2025, 77 out of 118 countries (65%) recorded an increase in their overall ETI scores, with an average gain of 1.1% – signalling a broad, though uneven, recovery in transition momentum. In total, 38%13 of countries recorded their strongest improvement in the dimension where they had previously scored lowest, potentially reflecting targeted efforts to close structural gaps. Meanwhile, only 28% of countries achieved gains across all three dimensions of the energy trilemma – underscoring how the transition is increasingly multi-speed and multidimensional, shaped by varying national priorities, capabilities and starting points.
Advanced economies continued to lead the rankings, accounting for 16 of the top 20 performers. The Nordics – Sweden, Finland, Denmark and Norway – retained the top positions, reflecting high performance across energy diversification, clean energy adoption, strong policy frameworks and reliable infrastructure. Sweden remained the top performer, with consistently strong scores across all three system dimensions – equitability, security and sustainability. Switzerland maintained its place in the top five while Norway re-entered the top five tier, highlighting renewed momentum in its energy transition efforts. Nevertheless, the highest-ranked countries showed room for improvement, as progress slowed in some cases.
Major economies showed selective gains with potential to lead. China led emerging Asia, with a 2.2% y-o-y ETI score gain and the fifth-highest transition readiness score globally – driven by strong innovation ecosystems and financial capacity. The US grew its score by 0.6% y-o-y and topped the security dimension, supported by supply diversity and robust infrastructure. India advanced in energy intensity, CH4 emissions and regulations and financial investments. Brazil led Latin America with steady progress in clean energy adoption and improved equity. Saudi Arabia, the second-best scorer in the Middle East, North Africa and Pakistan region, improved in security and was the country that improved the fastest in renewable capacity build-out.
Tailored reforms are accelerating progress across emerging Europe and emerging Asia. In emerging Europe, Latvia (the region’s leader) posted strong gains, while Bosnia and Herzegovina showed impressive momentum, helping the region achieve the highest score increase in 2025 (+2.8% y-o-y) – particularly in infrastructure (+8.3%) and equity (+5.6%). In emerging Asia, China led the region’s performance, backed by regulatory improvements and clean energy investment, while the Kyrgyz Republic demonstrated notable acceleration (+16.2%).
Latvia and the United Arab Emirates illustrate how focused policies can accelerate progress. Latvia entered the ETI top 10 for the first time, driven by a 7.9% y-o-y score increase supported by gains in equity, clean energy capital flows and renewable energy capacity buildout. Meanwhile the United Arab Emirates recorded the highest improvement in the Middle East (+7.9% y-o-y). This was enabled by targeted subsidy reforms,14 rising clean energy shares, falling energy intensity and continued expansion of the Barakah Nuclear Power Plant – now supplying nearly 25% of the country’s electricity.15 Nigeria also stood out, with one of the fastest improvements in transition readiness (+36.8% y-o-y), driven by major advances in investment capacity, infrastructure and regulation.
These cases highlight how diverse countries can drive rapid gains through targeted, context-specific efforts.
Top performers
The highest-ranking countries on the ETI continue to demonstrate what effective and resilient energy transition pathways can look like. In 2025, the top 10 performers continued to consist predominantly of advanced economies, most notably from Northern and Western Europe.
While they represent a small share of global energy demand and emissions, collectively accounting for only 3% of energy-related CO2 emissions, 4% of total energy supply, 2% of the global population and 9% of the global GDP, they provide valuable insights into long-term transition strategies (Table 2).
Despite their differences in geography and economic structure, they share five core enablers:
- Clear and stable policy signals: Governments provide long-term certainty through legally binding climate targets, national climate laws and regulatory frameworks that span sectors. Meanwhile, long-term roadmaps guide investment across sectors and tools like carbon pricing send strong market signals.
- Highly diversified clean energy mix and efficiency as a strategic priority: Countries rely more on renewables and nuclear, and less on fossil fuels, embedding energy efficiency in design and planning (e.g. district heating systems, low-energy buildings, smart metering).
- Modern infrastructure for secure and flexible energy systems: Governments strengthen energy resilience by modernizing grid infrastructure and integrating digital technologies – combining clean energy expansion with investments in flexibility, interconnection and storage.
- Strong industrial strategy and high investment in clean technology: Governments align climate ambition with economic strategy – combining green industrial policies with high public and private investment in innovation and commercialization of technologies like hydrogen, energy storage and smart grids.
- Social trust and just transition architecture: Environmental taxes are paired with strong welfare systems and fair access to clean technologies, ensuring sustained public support.
Table 2: Top 10 performers in the ETI 2025


Large economies: influencing the pace and priorities of transition
The true test of the global energy transition lies with the world’s five largest economies. While the ETI top 10 continue to offer strong examples of long-term leadership, it is the top five largest economies – China, the US, the EU, Japan and India – that will ultimately determine the pace and direction of the global energy transition due to their sheer size. Together, they account for around half of global GDP – measured in 2015 constant PPP (purchasing power parity) terms – population and total energy supply (TES), but nearly two-thirds of global emissions, giving them outsized influence through their consumption patterns, investment flows and policy choices.
Over the past decade, all five of these economies made progress in the energy transition (including above-average gains in sustainability). In particular, the US, EU and Japan made consistent gains in areas such as energy efficiency and emission intensity, and benefit from more mature regulatory regimes. Yet, the emerging markets of China and India experienced the greatest overall improvement, especially in increasing access to energy and strengthening transition readiness. While all of these economies will play a critical role in the future of the energy transition, they each have differing strengths and challenges (Table 3) that require varied approaches.
Table 3: Top five largest economies in the ETI 2025


Regional trends
Average ETI scores varied significantly across regions, reflecting differences in energy demand profiles, institutional capacity and economic structure.
Figure 4: Regional performance snapshot


Table 4: Regional strengths and challenges in the energy transition


Regional dynamics – from fossil-fuel-rich economies in the Middle East to rapidly growing markets in Asia – underscore the diversity of transition pathways, challenges and enablers shaping the global energy landscape. These country-level and regional spotlights illustrate where momentum is accelerating, where persistent barriers remain and how both emerging and resource-rich economies are redefining their roles within the evolving energy system.
Collectively, these insights reinforce a critical shift: the energy transition will not follow a single, uniform path but will instead require context-specific strategies tailored to local strengths and limitations.