The Global Cooperation Barometer 2026 – Third Edition


1. The five pillars of the Global Cooperation Barometer
Cooperation is strongest in areas where agile coalitions are emerging.
The Global Cooperation Barometer measures global cooperation across five areas, or pillars: trade and capital, innovation and technology, climate and natural capital, health and wellness, and peace and security. In each pillar, the barometer examines evidence of cooperative actions and their outcomes to determine an overall level of global cooperation in that area.
Pillar 1: Trade and capital
Cooperation refocused on intangible flows, often driven by a desire to reshape interdependencies, while 2025 brought uncertainty about trade barriers as well as decreased labour flows.
The trade and capital pillar looks at cooperation through flows of goods and services, trade, capital and people. It includes metrics about the magnitude of flows – such as foreign direct investment (FDI) or labour migration – and the distribution of flows across different economies.
The latest barometer reading indicates cooperation in trade and capital stayed broadly flat (Figure 4), but beneath the surface, changes are evident. Flows of services and capital continued to rise. However, overall trade volumes experienced headwinds. While they have nearly kept pace with the overall economy – including in 2025 – material changes in trade ties are unfolding.
Figure 4: Trade and capital held steady in 2024, capital and services increased, while goods trade and official development assistance (ODA) decreased
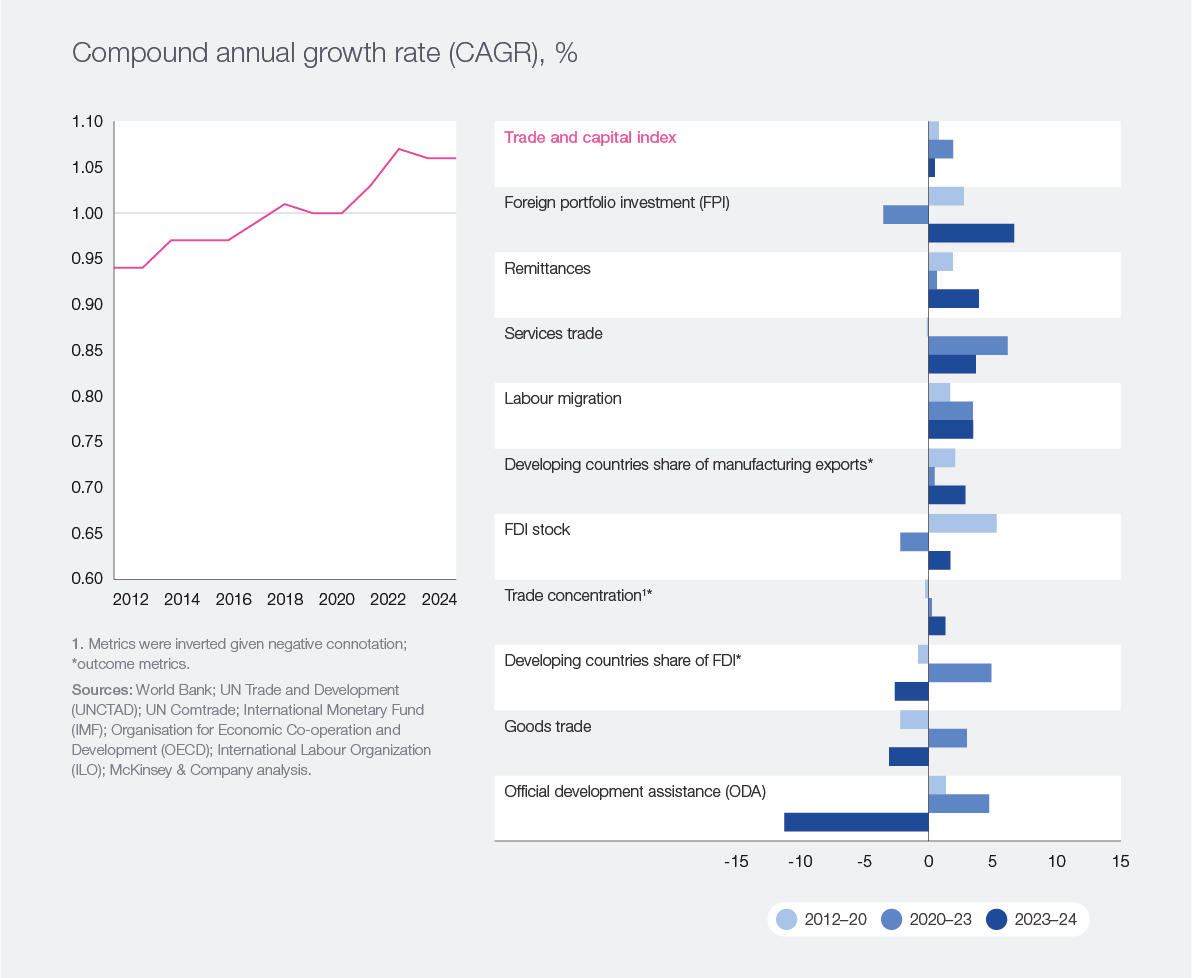

Goods trade, the historical core of this pillar, grew slightly slower than overall GDP (gross domestic product), leading to a slight decline in this metric. More notable than the overall value of trade is its composition. As the global multilateral system sees pressures, a large reconfiguration in trading partners is playing out: McKinsey Global Institute research finds goods trade is falling between countries that are geopolitically distant (less aligned), and instead shifting towards more geopolitically proximate partners. The average geopolitical distance of global goods trade has fallen by about 7% between 2017 and 2024.12
Developing countries and China have gained a larger share of manufacturing exports: in 2024, their exports rose by $276 billion, or 5 percentage points, of which China represented more than half the total growth. Overall trade relationships slightly diversified, as the trade concentration metric fell by about 1%.13 Taken together, these shifts suggest that global trade is redistributing within aligned networks while diversifying across partners.
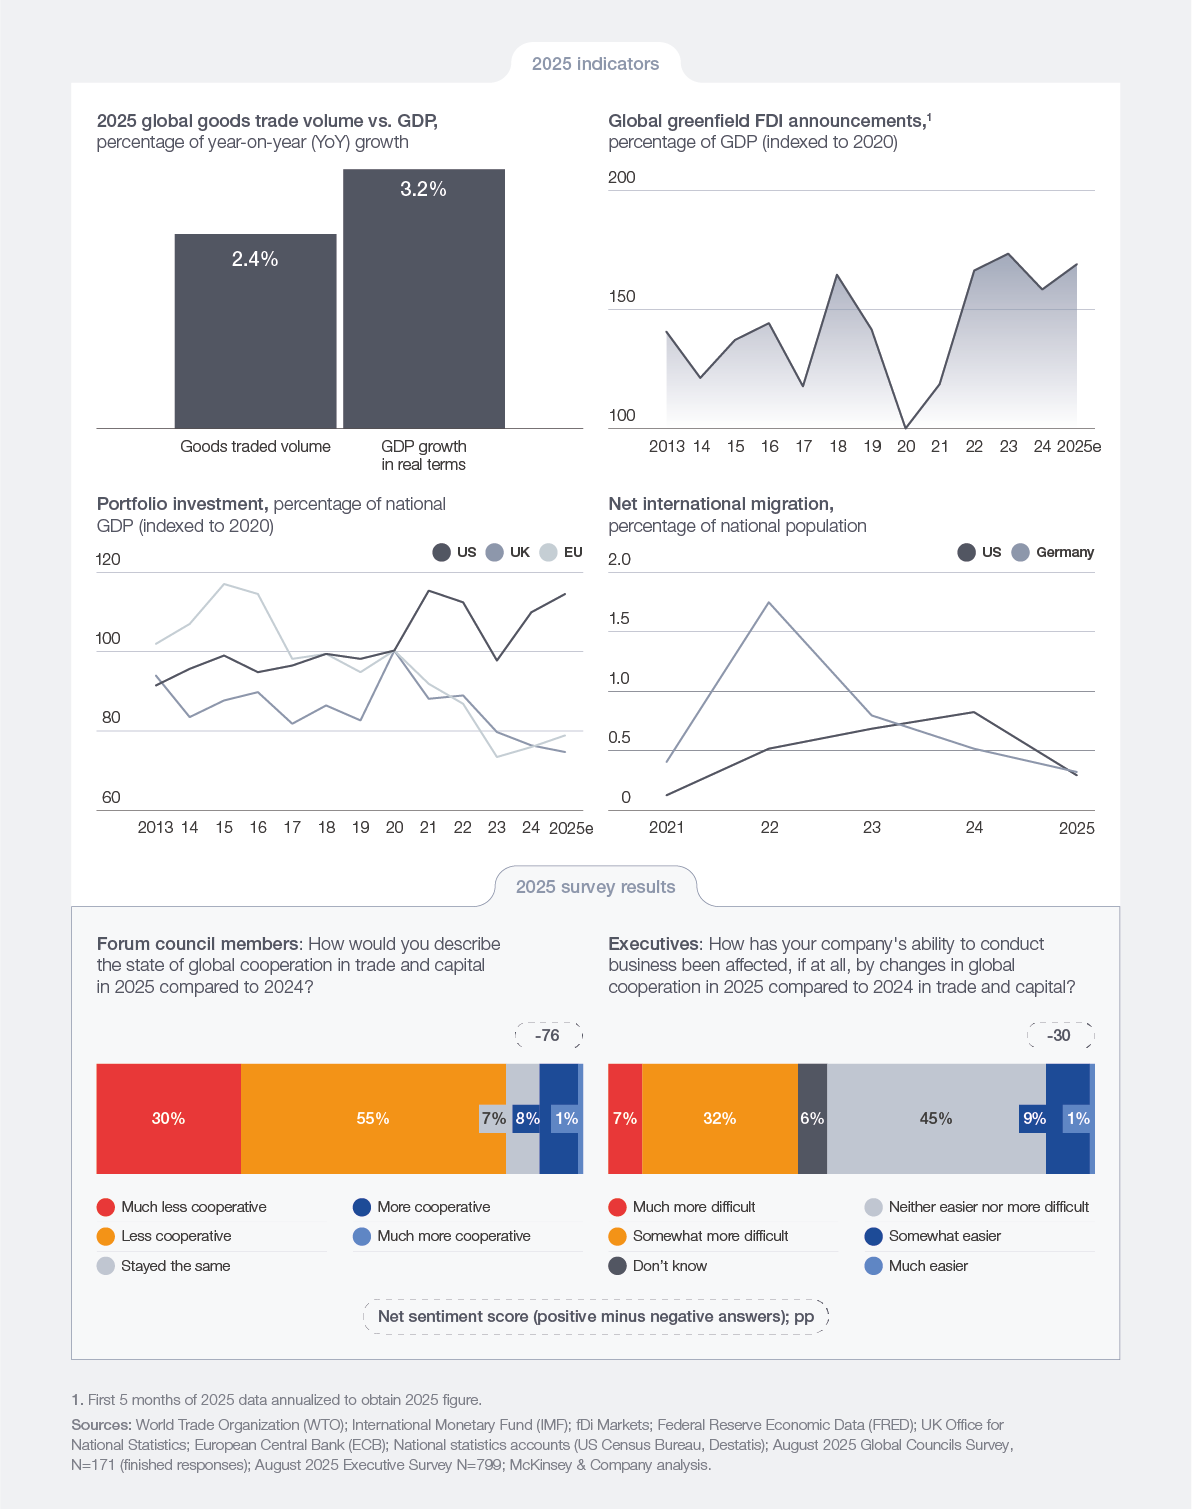
Undeniably, a series of US tariff announcements in 2025 raised questions about the future of trade. Early indicators suggest that rather than leading to a contraction, these announcements have fuelled a reconfiguration. Trade volumes are estimated to have grown in 2025 (by about 2.4%), though slightly below the pace of real GDP growth (3.2%).14,15 However, reconfiguration intensified – US imports from China fell by about 20% in the first seven months of 2025, compared to the same period in 2024, while imports from geopolitically closer partners in Europe and Asia increased.16
Flows of capital and services, on the other hand, trended upward.17 This was often motivated by countries seeking to attract know-how and capital from overseas to boost their own domestic capabilities. Cross-border capital flows have increased continually since 2022, with growth in metrics that track foreign portfolio flows and direct investment stock. In the case of FDI, newly announced greenfield projects have surged in future-shaping industries and the resources that power them – semiconductors, data centres/AI, electric vehicle (EV) batteries, and critical minerals – as nations work with their close partners to build capacity in strategically sensitive areas. Compared to trade, the geopolitical distance of greenfield FDI has fallen about twice as fast.18 Much of this pipeline is heading to advanced economies – particularly the US – as they invest more in one another and reduce FDI announcements into China, whose share fell from 9% of total announced FDI inflows in 2015–19 to only 3% in 2022–25.19 These trends further intensified in 2025.
Services trade also ratcheted higher, continuing its five-year run of growth since the low point of 2020. Gains were mostly driven by digitally delivered services (such as IT services), travel and other business services (professional, technical, R&D/engineering).20 In 2025, WTO estimates point to moderating but still positive growth in services trade, with digitally delivered services remaining firm as travel and transport normalize under lingering policy uncertainty.21
As in most pillars, metrics closely associated with global multilateral cooperation fell the most. Official development assistance (ODA) had the largest decline in this pillar, 10.8% in 2024, marked by lower aid to Ukraine, reduced humanitarian aid and weakened refugee spending. Only four countries exceeded the UN target of 0.7% GNI (gross national income), as countries adjusted their priorities amid a more fragmented global landscape. For 2025, the Organisation for Economic Co-operation and Development (OECD) estimated another 9–17% fall in ODA, reflecting multi-year reductions across several top donors.22
Finally, after growing uninterruptedly since 2020, international labour migration may be approaching an inflection point. The global stock of labour migrants grew in 2024, but signs of a slowdown emerged; for example, new migration flows to OECD countries weakened by 4% in 2024.23 In 2025, a sharp contraction played out. Net migration inflows into the US and Germany fell by an estimated 65% and 39% compared to 2024, respectively (Figure 5).24
While 2025 certainly introduced new tensions, the direction of travel was often consistent with previous years. The goods trade share of the global economy declined slightly, capital flows increased and labour migration restrictions intensified. In this landscape, about 85% of the council members surveyed perceived cooperation to be broadly declining. Forty percent of surveyed executives pointed to growing barriers in trade, talent and cross-border capital flows as hampering their ability to do business. Notably, though, the remaining 60% said the effects were not substantially negative, at least to date. This may illustrate the fact that many organizations have found ways to readjust their strategies to navigate increased turbulence in the world of trade.25
Looking ahead, there are many fast-moving currents under the surface – such as opportunities to rearrange trade between new partners, and participate in fast-growing corridors such as those between emerging economies.26,27 Recent examples of increased cooperation – from major players and coalitions of smaller economies – include the September 2025 launch of the Future of Investment and Trade (FIT) Partnership that is bringing together 14 small and medium-sized economies in trade; the graduation of the EU– Mercosur accord into the adoption phase; the conclusion of the EU–Indonesia deal after a decade; the conclusion of a Digital Economy Framework Agreement (DEFA) among ASEAN nations; and the US striking bilateral deals for critical minerals with close partners (e.g. Australia in October 202528). Of course, the idea of smaller trade coalitions is not new – more than 370 regional trade agreements have been signed since 1995.29 The challenge moving forward will be for companies and countries to navigate a spectrum of preferences and market access arrangements – and what this will eventually mean for global commercial flows.
Figure 5: 2025 overview of trade and capital – indicators and survey

Pillar 2: Innovation and technology
Cooperation in this pillar increased, propelled by investment to spur advances in AI deployment, while 2025 brought new uncertainties, such as increasing restrictions.
The innovation and technology pillar examines elements of global cooperation that can accelerate innovation and create beneficial technological progress.
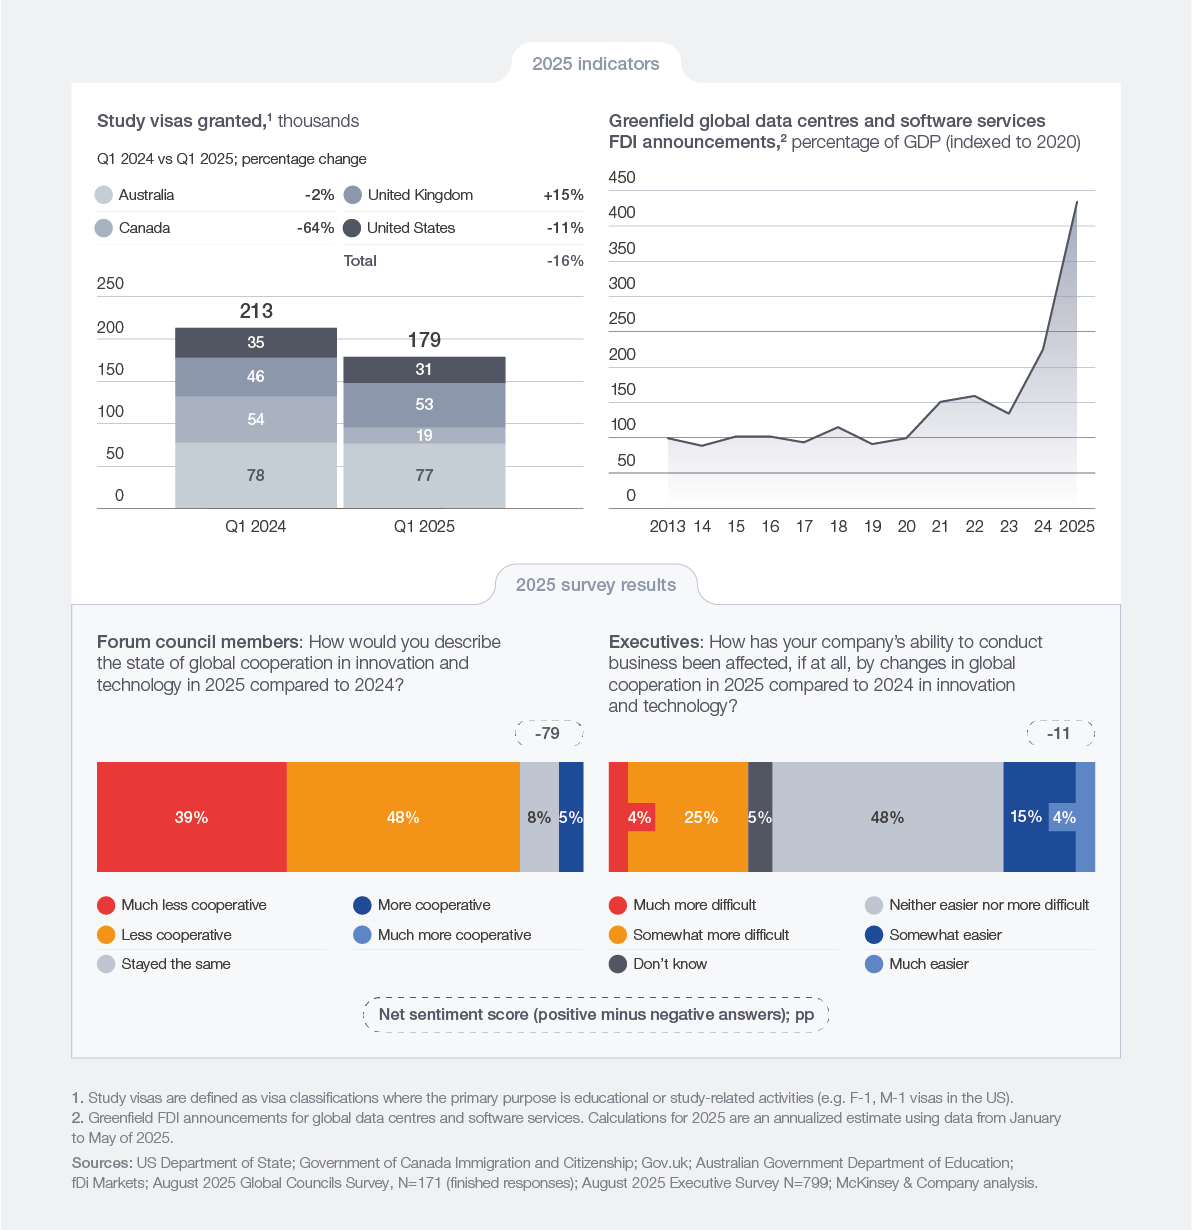
The topline measurement of cooperation in this pillar rose approximately 3% year-on-year (YoY), propelled by increases in data flows and IT trade of goods and services (Figure 6). While some metrics returned to growth after earlier declines, there are signs of uncertainty ahead. Cooperation on cross-border research is down. Collaboration deteriorated in the trade of components of frontier technologies, whose flows are increasingly tied to geostrategic considerations. This has manifested, for example, in tighter controls on certain leading-edge technologies, resources and associated intellectual property, especially between the US and China. Perhaps because of this, respondents to the Global Cooperation Barometer survey said this pillar was the least likely to see improved cooperation.
Figure 6: Most innovation and technology metrics rose in 2024
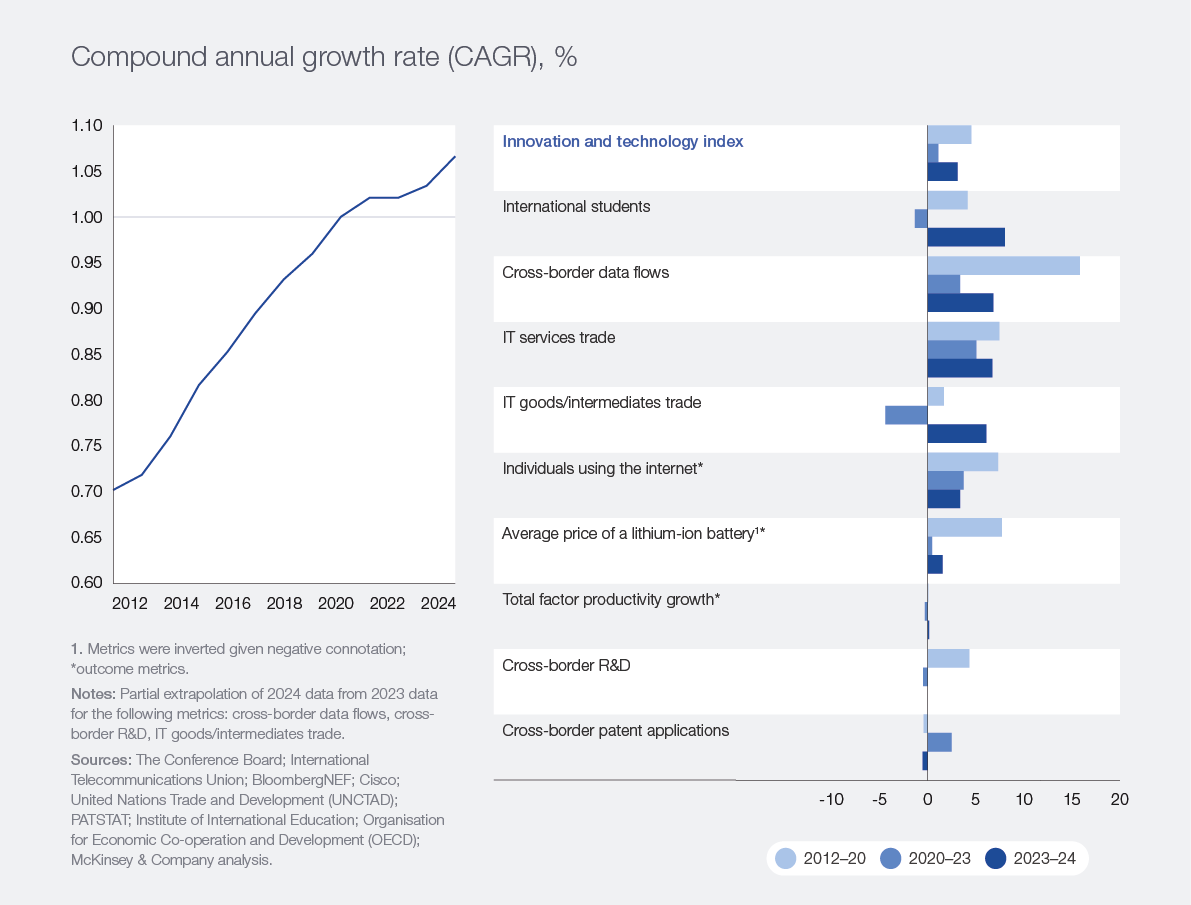

Advances in digitization continued to underpin growth in global connectivity, through rising data flows and IT trade, a 25% YoY increase in international bandwidth (which is now four times larger than in 2019), and continued investments in digital infrastructure – often driven by national agendas and the quest to secure advantages in the AI digital race. In parallel, IT services continued to show growth – an uninterrupted run since before the pandemic – and IT goods trade reverted to growth after contracting in 2023. In doing so, IT goods bucked the larger trend in goods trade, consistent with countries channelling investment into AI capabilities, as cooperation incentives align with furthering technological progress.
In 2025, the AI race led to even more increases in cross-border activity. Greenfield FDI announcements in data centres30 reached record highs, estimated at about $370 billion globally in 2025,31 up from about $190 billion in 2024. These new projects may drive corresponding increases in cross-border flows of IT goods – chips, electronic components, communications equipment and IT services over the near to medium term (Figure 7).
These developments also have the potential to boost productivity, after many years of the barometer showing total factor productivity stuck in neutral. For example, recent McKinsey Global Institute estimates suggest generative AI could increase global productivity growth by 0.1 to 0.6 percentage points annually until 2040.32
Still, growing barriers and restrictions create uncertainty about the future. Although the flow of international students grew more than any other metric in this pillar in 2024, rising by 8% and surpassing pre-pandemic levels, this momentum may soon moderate as restrictions on talent mobility increase. Early indicators point to a contraction in 2025: new US F-1 and M-1 student visas declined by 11% in Q1 2025, and similar declines occurred in other countries, including Australia33 and Canada.34
Perhaps no barrier has been more salient than expanded controls on frontier technologies and resources, especially but not limited to those deployed by the US and China.35 Elsewhere, however, collaboration in critical technologies such as AI data centres, semiconductor fabrication and 5G infrastructure persists among small groups of countries, including new partnerships between the US and partners in Europe, the Gulf and India; and China’s new partnerships with the Middle East, South-East Asia and Africa.36
These headwinds are perhaps why surveyed council members expressed considerable pessimism regarding the future of cooperation in this pillar. Eighty-seven percent of the surveyed experts felt that 2025 would be “less cooperative” or “much less cooperative” when it comes to innovation and technology, making survey responses for innovation and technology the most pessimistic among the five pillars.
Ultimately, even in a more fragmented landscape, pragmatic cooperation will continue wherever shared incentives are clear, such as in standards bodies, cloud and data arrangements and applied AI deployments, even as controls tighten. Leaders can keep innovation moving by separating sensitive intellectual property (IP) from scalable interfaces, investing in cross-certification and benchmarking and using regional agreements to deploy at speed where rules and incentives already line up.
Figure 7: 2025 overview of innovation and technology – indicators and survey

Pillar 3: Climate and natural capital
Cooperation in climate continued to rise as trade and finance enabled more deployment of clean energy, but remained insufficient to make material progress on climate outcomes.
The climate and natural capital pillar looks at global cooperation on lowering emissions, preserving natural capital and preparing for the likely effects of climate change through a combination of cooperation on finance flows and global supply chains.
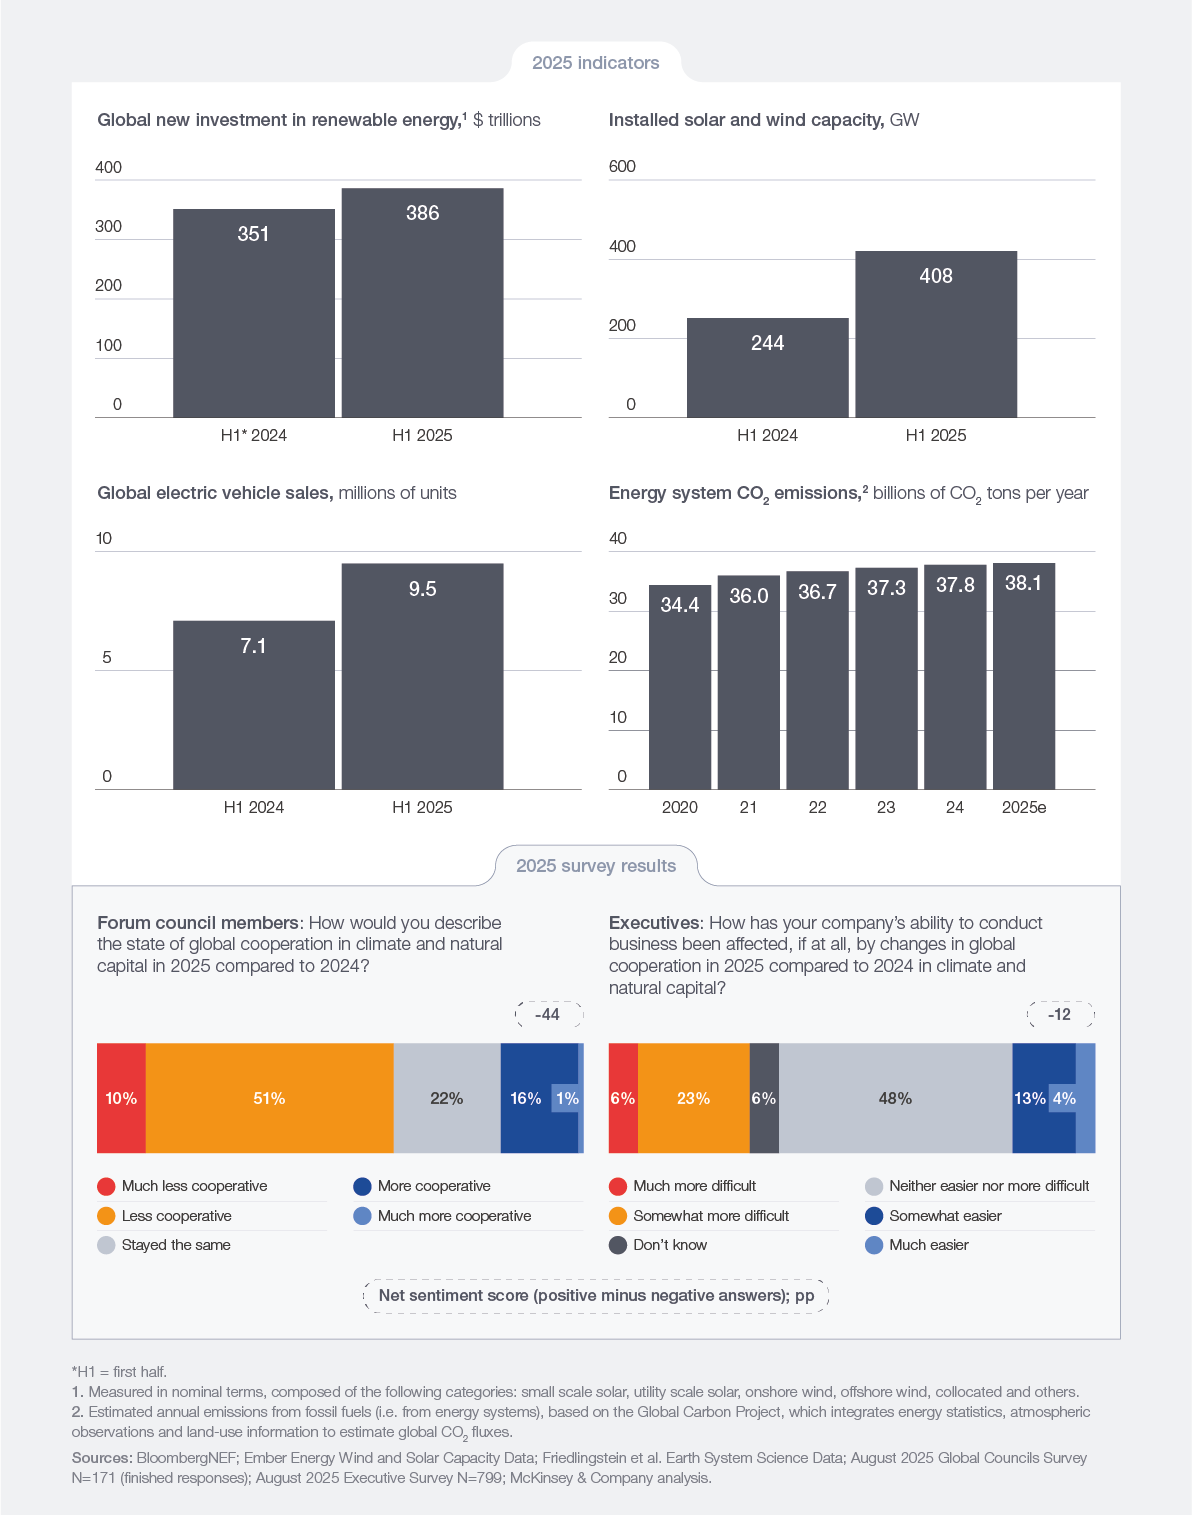
The latest barometer reading shows cooperation in this pillar rose, but with two contrasting dynamics. Cooperation increased in cross-border trade and global climate financing – the largest increases in this pillar – which enabled the continued rise in deployment of clean technologies (Figure 8). Solar and wind capacity additions in 2024 doubled compared to 2022 – from 300 to 600 gigawatts (GW),37 and were 60% higher in the first half of 2025 compared to the same period of 2024.38 In fact, in the last 18 months, the world installed more solar capacity than in the previous three years combined. Yet, these increases were not enough. Outcomes related to natural capital and climate deteriorated, as deployment remains below the level needed to meet climate objectives aligned with the Paris Agreement.
Figure 8: Climate cooperation grew, spurred by climate finance and low-carbon goods trade

It may appear surprising that green financing and trade of green goods rose, given the pressures on multilateral mechanisms that traditionally support the flows of these components of climate action. One way to understand the growth of cooperation in clean technologies is as a convergence of global goals (such as emissions reductions) with domestic priorities. Many of these technologies have become more affordable, contributing to energy security by reducing dependence on foreign sources of energy and even expanding access to populations that previously lacked it. For example, the deployment of increasingly affordable EVs has contributed not only to emissions reductions, but has also displaced oil consumption in China and Europe – two regions that rely on oil imports. In Pakistan, imports of increasingly affordable solar panels have enabled local populations to increase access to energy.39
Financing for climate technologies, which includes international and domestic funding, was a key aspect of rising global cooperation. Mitigation finance continued its five-year run of growth, rising to approximately double its pre-pandemic value by 2024. Particularly important are funds flowing to emerging economies, which almost doubled from 2018 to 2023, and were further boosted in 2024 by multilateral development banks (MDBs).40,41 Adaptation finance is also estimated to have grown – and could be further propelled by a new deal struck at COP30 to triple adaptation finance by 2035.42
Yet the landscape of climate cooperation remains complex. Cooperation in mitigation finance grew by just 10% in 2024, the slowest since 2020. Cuts in ODA have multiplied, and international partnerships have fallen short of expectations. The Just Energy Transition Partnerships – an international financing mechanism that assists emerging economies’ transition towards low-emission energy sources – delivered only $7 billion by June 2025, against a $50 billion commitment.
Trade in low-carbon goods was the other large growth engine of global cooperation. Global supply chains helped manufacturers reach scale and lowered prices. That in turn allowed their deployment in many emerging economies. For example, India – which added the second-most solar in 2025 after China – and Brazil gained access to affordable solar modules and stepped up installations.43 In 2025, solar, wind and EV sales in emerging economies outpaced those of the US and parts of Europe, where momentum declined. Nonetheless, there are concerns that the supply of these goods is overly concentrated in China, which accounts for the vast majority (up to 70% or even 80%) of the manufacturing of many clean technologies.44
Despite the growth in investment, trade and deployment, environmental outcomes continued to deteriorate. Research from the McKinsey Global Institute finds that deployment in the energy transition is progressing at half the speed needed to meet stated climate goals.45 Emissions continued to rise in 2024, as they have done steadily for most of the past few decades.46 There is one bright spot in the story: emissions intensity (measured as emissions/GDP) is dropping, signalling the world’s ability to continue delivering economic growth while making headway in managing emissions.
The story for natural capital is equally sobering: after several years of steady progress, cooperation has lost momentum. Ocean health is declining. Growth in terrestrial and marine protected areas stalled during 2023–24, marking a reversal from the moderate growth experienced since 2020. Growth could renew soon, as projects such as the announced expansion of French Polynesia’s marine protected area take hold, and COP30 in Brazil saw the launch of a new vehicle to boost investment in terrestrial protected areas.47
In 2025, some indicators showed that the dynamics of previous years persisted. Investment in renewable energy and newly installed solar and wind capacity, and trade in low-carbon goods, continued to increase. Yet emissions from the energy system continue to grow, and there are signs that growth in climate finance is starting to weaken.48 The mixed state of climate cooperation is reflected in the two surveys presented in this report. Almost two-thirds of experts think cooperation in climate and natural capital was “much less cooperative” or “less cooperative” in 2025. A significantly smaller fraction of executives pointed to this area as one that harmed their ability to conduct business across borders. Importantly, though, many found reasons for optimism. Seventeen percent of surveyed council members expected 2025 would be “more cooperative” or “much more cooperative” – the highest number across the pillars.
Achieving sustained progress on climate outcomes may require new forms of cooperation. Multilateral efforts still play a role, as recent advances such as the High Seas Treaty show. However, as seen in failed efforts to craft a Global Plastics Treaty in 2025 and delays in securing final adoption for net-zero international shipping emissions,49 the current environment remains challenging for turning aspirations into international agreements.
Instead, states are advancing climate goals through smaller intra- and inter-regional coalitions. The EU and Central Asia forged a hydrogen partnership in September 2025 at the second Central Asian Regional Forum on Decarbonization Diplomacy in Astana.50 At the regional level, the European Commission put forward the Clean Industrial Deal plan in February 2025, aiming to make decarbonization efforts a driver of industrial growth across the continent. In ASEAN, the LTMS-PIP cross-border power-trading partnership among Laos, Thailand, Malaysia and Singapore is an early step towards integrating renewable energy in the region.
Figure 9: 2025 overview of climate and natural capital – indicators and survey

Pillar 4: Health and wellness
Overall cooperation remained steady, as health outcomes held, but flows of global aid eroded sharply, signalling potential challenges ahead.
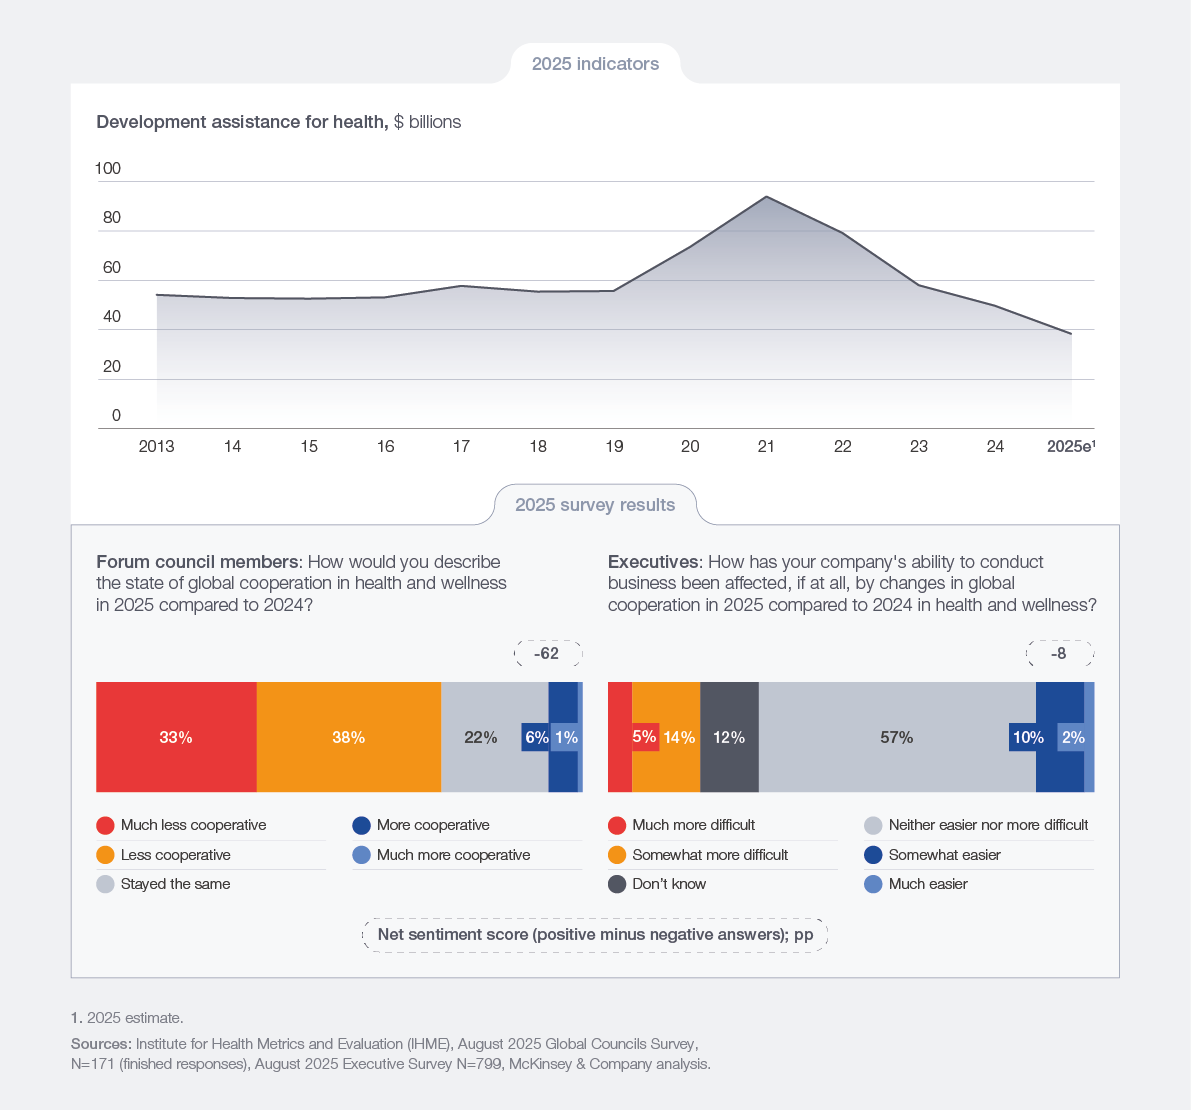
The barometer shows that topline cooperation in the health and wellness pillar held steady, supported by resilient health outcomes, which may reflect a gradual “normalization” after having dropped during the pandemic. This stability, however, masks a growing fragility. Pressures on multilateral organizations have eroded aid support, and development assistance for health (DAH) has contracted sharply. The result is that costs are shifting to lower-income countries, potentially endangering health outcomes in the future.
Figure 10: Health outcomes continued to improve, but development assistance for health declined

The heaviest pressure on this pillar was the drop in DAH, which fell 6% to $50 billion in 2024, continuing its erosion since 2021. Key donors, including Germany, the United Kingdom and the US, cut funding.
Donations through multilateral channels pulled back more than those in bilateral channels; their funding fell by about 20%, while country-to-country funding contracted by 3%.51 This may suggest that the aid landscape is increasingly tilting towards bilateral arrangements, which can prioritize medicines, diagnostics and frontline delivery. While helpful at the point of care, these arrangements could impose more pressure on recipient governments, as they typically leave system costs uncovered, shifting those on to domestic budgets. For example, the new US guidance for its HIV programme aims for services to be managed by domestic actors (PEPFAR COP25 Strategic Guidance), and similarly, the United States Agency for International Development (USAID) tightened cost-sharing rules for recipient governments.52
Estimates for 2025 indicate further worsening, with global DAH declining by an additional $11 billion,53 largely because US funding agencies are expected to cut about $9 billion.54 As a result, it is not surprising that many council members and executives expect cooperation in this pillar to deteriorate further (Figure 10).
Health outcomes have not yet started to reflect the potential impacts of the shift taking place. In 2024, all health outcomes – including disability-adjusted life years (DALYs), life expectancy, child mortality and maternal mortality – showed progress. However, health outcomes often lag their drivers significantly, and these improvements might be capturing a post-pandemic rebound, and perhaps also the results of longer-term cooperation. Although these indicators reflect positive outcomes, other evidence points to a widening gap between “healthspan” and lifespan,55 as health-adjusted life expectancy lags gains in life expectancy. Put simply, this means people are living more years with illness.
Despite a slowdown in overall goods trade (as discussed in the trade and capital pillar), trade in health goods increased in 2024. This increase was propelled by innovation-led demand in pharmaceuticals – most visibly a rise in GLP-1 therapies, and exports from hubs such as Ireland, Denmark and Switzerland feeding US/EU demand. The WTO’s “zero-for-zero” deal also kept pharmaceuticals tariffs near zero.56
Recent global multilateral efforts – such as WHO’s Pandemic Agreement (though not yet ratified and without US participation57) and the UN General Assembly’s declaration on non-communicable diseases and mental health – signal continued commitment to coordination in global health governance. Meanwhile, regional cooperation is gaining definition, exemplified by the Organisation of Eastern Caribbean States scaling a model to reduce the price of insulin throughout the region, the launch of the African Medicine Agency, as well as the Accra consensus, with African governments aligning on shared priorities and execution.58
Looking ahead, the critical question is the extent to which fading global multilateral efforts could translate into worse health outcomes. As global financial flows weaken and the remaining support flows limit their coverage to treatment and delivery, pressures on domestic health budgets will rise. Many domestic economies will be unable to make up for the shortfall, and the test ahead will be whether progress on health outcomes can be sustained.
Figure 11: 2025 overview of health and wellness – indicators and survey

Pillar 5: Peace and security
Global cooperation declined sharply, as conflicts escalated in many parts of the world.
The peace and security pillar examines the impact of global cooperation in preventing and resolving conflicts. The focus is on preventing death and ameliorating the long-term negative implications of conflict through the commitment to multilateral peacekeeping operations and international stabilization efforts.
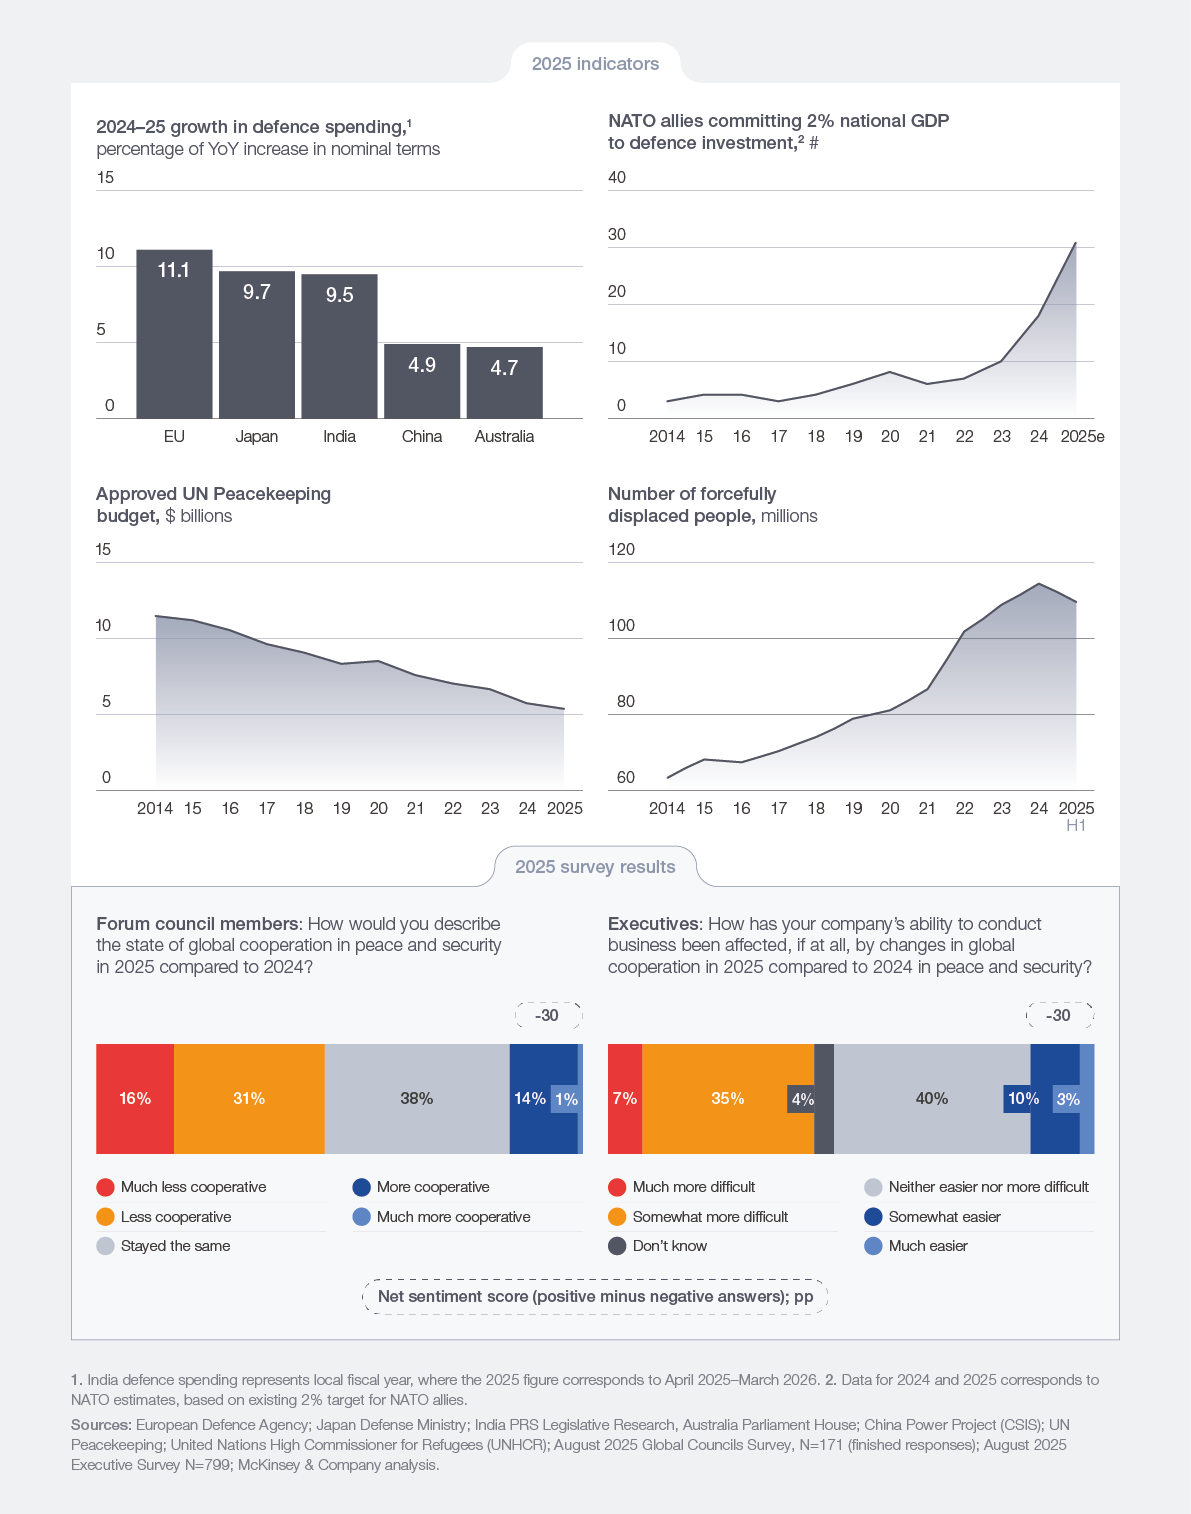
The barometer shows peace and security cooperation is under the greatest strain of all five pillars, with almost every metric in 2024 below pre-pandemic levels (Figure 12). The decline of this pillar since the late 2010s reflects an intensification of conflict and attendant harm to individuals. Global multilateralism has struggled in its role as peacekeeper, although regional formats of cooperation have picked up the mantle in some cases.
Figure 12: Peace and security eroded with declines across most metrics
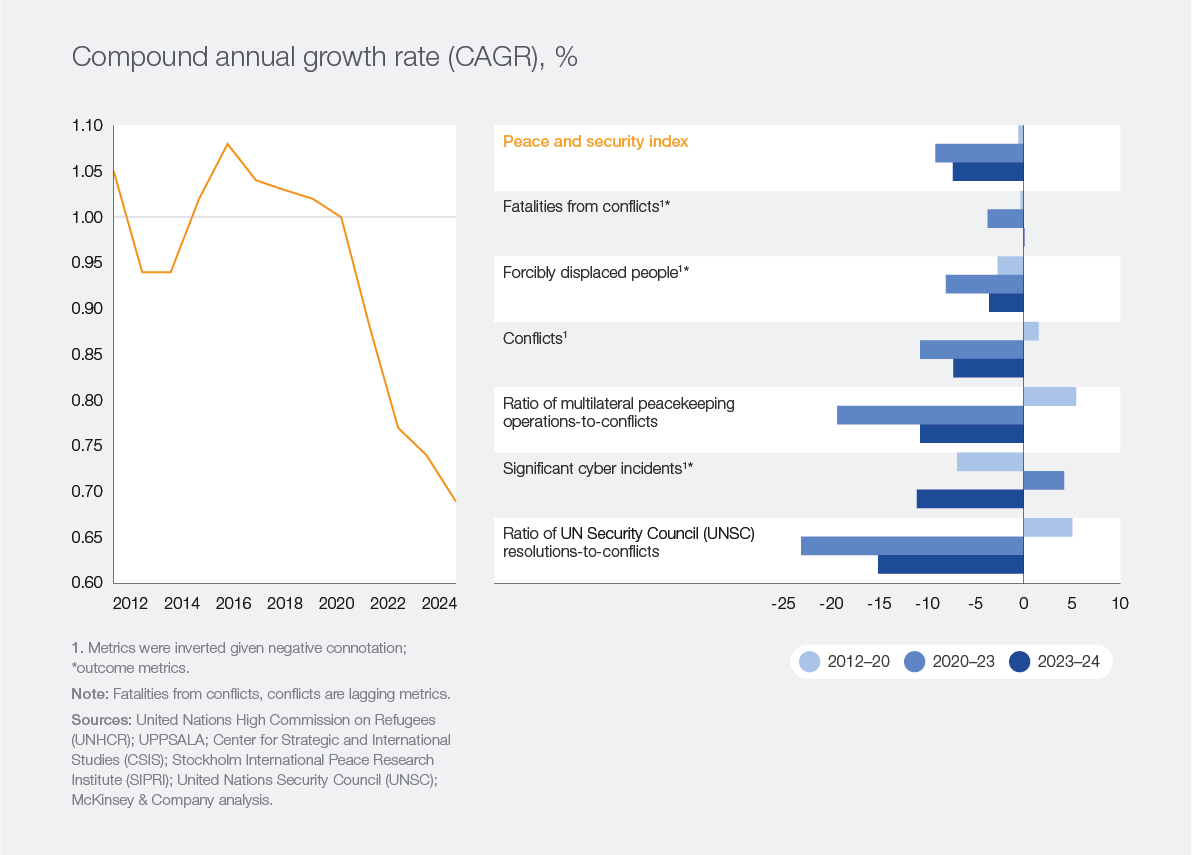

In 2024, the number of conflicts continued to increase,59 marked by, among others, the ongoing Russia–Ukraine conflict, the Israel–Hamas war in Gaza, hostilities between Israel and Hezbollah, intensified fighting in eastern Democratic Republic of Congo and civil wars in Sudan and Myanmar. Reported battle-related deaths stayed near 2023 levels, with the Russia–Ukraine conflict making up over 40% of the total. The number of forcibly displaced people likewise continued its growth, reaching a record 123 million.60 The war in Sudan alone displaced approximately 11.5 million people.61
Beyond the kinetic sphere of conflict, other dimensions also worsened. Cyberattacks intensified, with incidents surging across Asia,62 the Middle East63 and Europe – including high-profile attacks affecting large organizations across both the public and private sectors.64 “Grey-zone” activity and infrastructure disruptions across digital and energy infrastructure also intensified, especially in 2025. Europe experienced gas‑pipeline sabotage and damage to sub-sea cables, while three major multi-cable outages occurred in the Red Sea and West Africa.65
The sharpest decline in this pillar was the deterioration in global multilateral actions, namely resolutions and peacekeeping missions, which have not kept pace with the growth of conflicts. The number of UN Security Council (UNSC) resolutions fell from 50 in 2023 to 46 in 2024, and the ratio of multilateral peace operations to conflicts declined by about 11% YoY. This reflects heightened geopolitical tensions, which have made conditions difficult for UN intervention. Until the UNSC vote in November 2025 authorizing an international stabilization force for the Gaza Strip, the UNSC had not mandated a new peacekeeping operation since 2014.66 Furthermore, budget cuts have put pressure on existing missions – personnel deployed to multilateral peace operations fell by more than 40% between 2015 and 2024, and a budgetary crunch disrupted a mission’s function in 2024.67 In this context, the role of the UN’s engagement has evolved, leaning more on special political missions and special envoys, concurrent with a rise in regionally led frameworks.68
Given the pressures on peace and security, it is perhaps not surprising that perceptions of cooperation are pessimistic. About half of surveyed council members expected cooperation to deteriorate, and about half of surveyed executives pointed to developments in peace and security as affecting their ability to conduct business. This was the highest of any pillar after trade and capital (Figure 13).
These tensions are also manifesting in how economies prepare for the future; many have responded by increasing defence spending, including China, India, the EU, Japan and Australia. In parallel, all 32 NATO member states met the defence spending target of 2% of GDP in 2025, whereas more than 10 fell short the year before.69 With NATO raising its spending target to 5% of GDP for 2035,70 national defence spending is set to rise further.
Still, there are some sources of hope. Survey respondents noted that major powers have so far managed their rivalries with restraint, preventing competition from evolving into escalation.71 A panel of geopolitical experts interviewed for this report highlights the rise of “patchwork resilience”, where cooperation is succeeding in regional initiatives despite receding in global multilateral arrangements.
Indeed, successful cooperation in this pillar has been achieved through smaller coalitions. Several regional bodies have stepped up to stabilize or manage crises (such as the African Union-led security transition in Somalia, and Southern African Development Community deployments in Mozambique and the eastern Democratic Republic of Congo). Beyond formal frameworks, minilateral diplomacy also contributed to de‑escalation in 2025. Türkiye mediated talks between Ethiopia and Somalia under the Ankara Declaration, leading to a de-escalation of tensions.72 Armenia and Azerbaijan agreed on the text of a peace treaty and steps to keep third-country forces off their borders – with EU/US facilitation.73 These examples underscore how, even as large UN troop deployments recede, tailored coalitions can still reduce risks and open channels for political settlement.
Figure 13: 2025 overview of peace and security – indicators and survey