What are the drawbacks of today's plastics economy?

Image: REUTERS/Paulo Santos

Get involved with our crowdsourced digital platform to deliver impact at scale
Stay up to date:
Future of the Environment
At the 2016 World Economic Forum’s annual meeting in Davos, we launched a report called The New Plastics Economy: Rethinking the future of plastics. This report provides, for the first time, a vision of a global economy in which plastics never become waste, and outlines concrete steps towards achieving the systemic shift needed. Among the multiple symptoms revealing the current system’s drawbacks, two are arguably amongst the most striking: our analysis indicates (i) that 95% of the value of plastic packaging material, worth $80-120 billion annually, is lost to the economy, and (ii) that, on the current track, there could be more plastics than fish in the ocean (by weight) by 2050. This blog post provides some background information on the data and methodology that led to the latter insight.
How much plastic is there in the world?
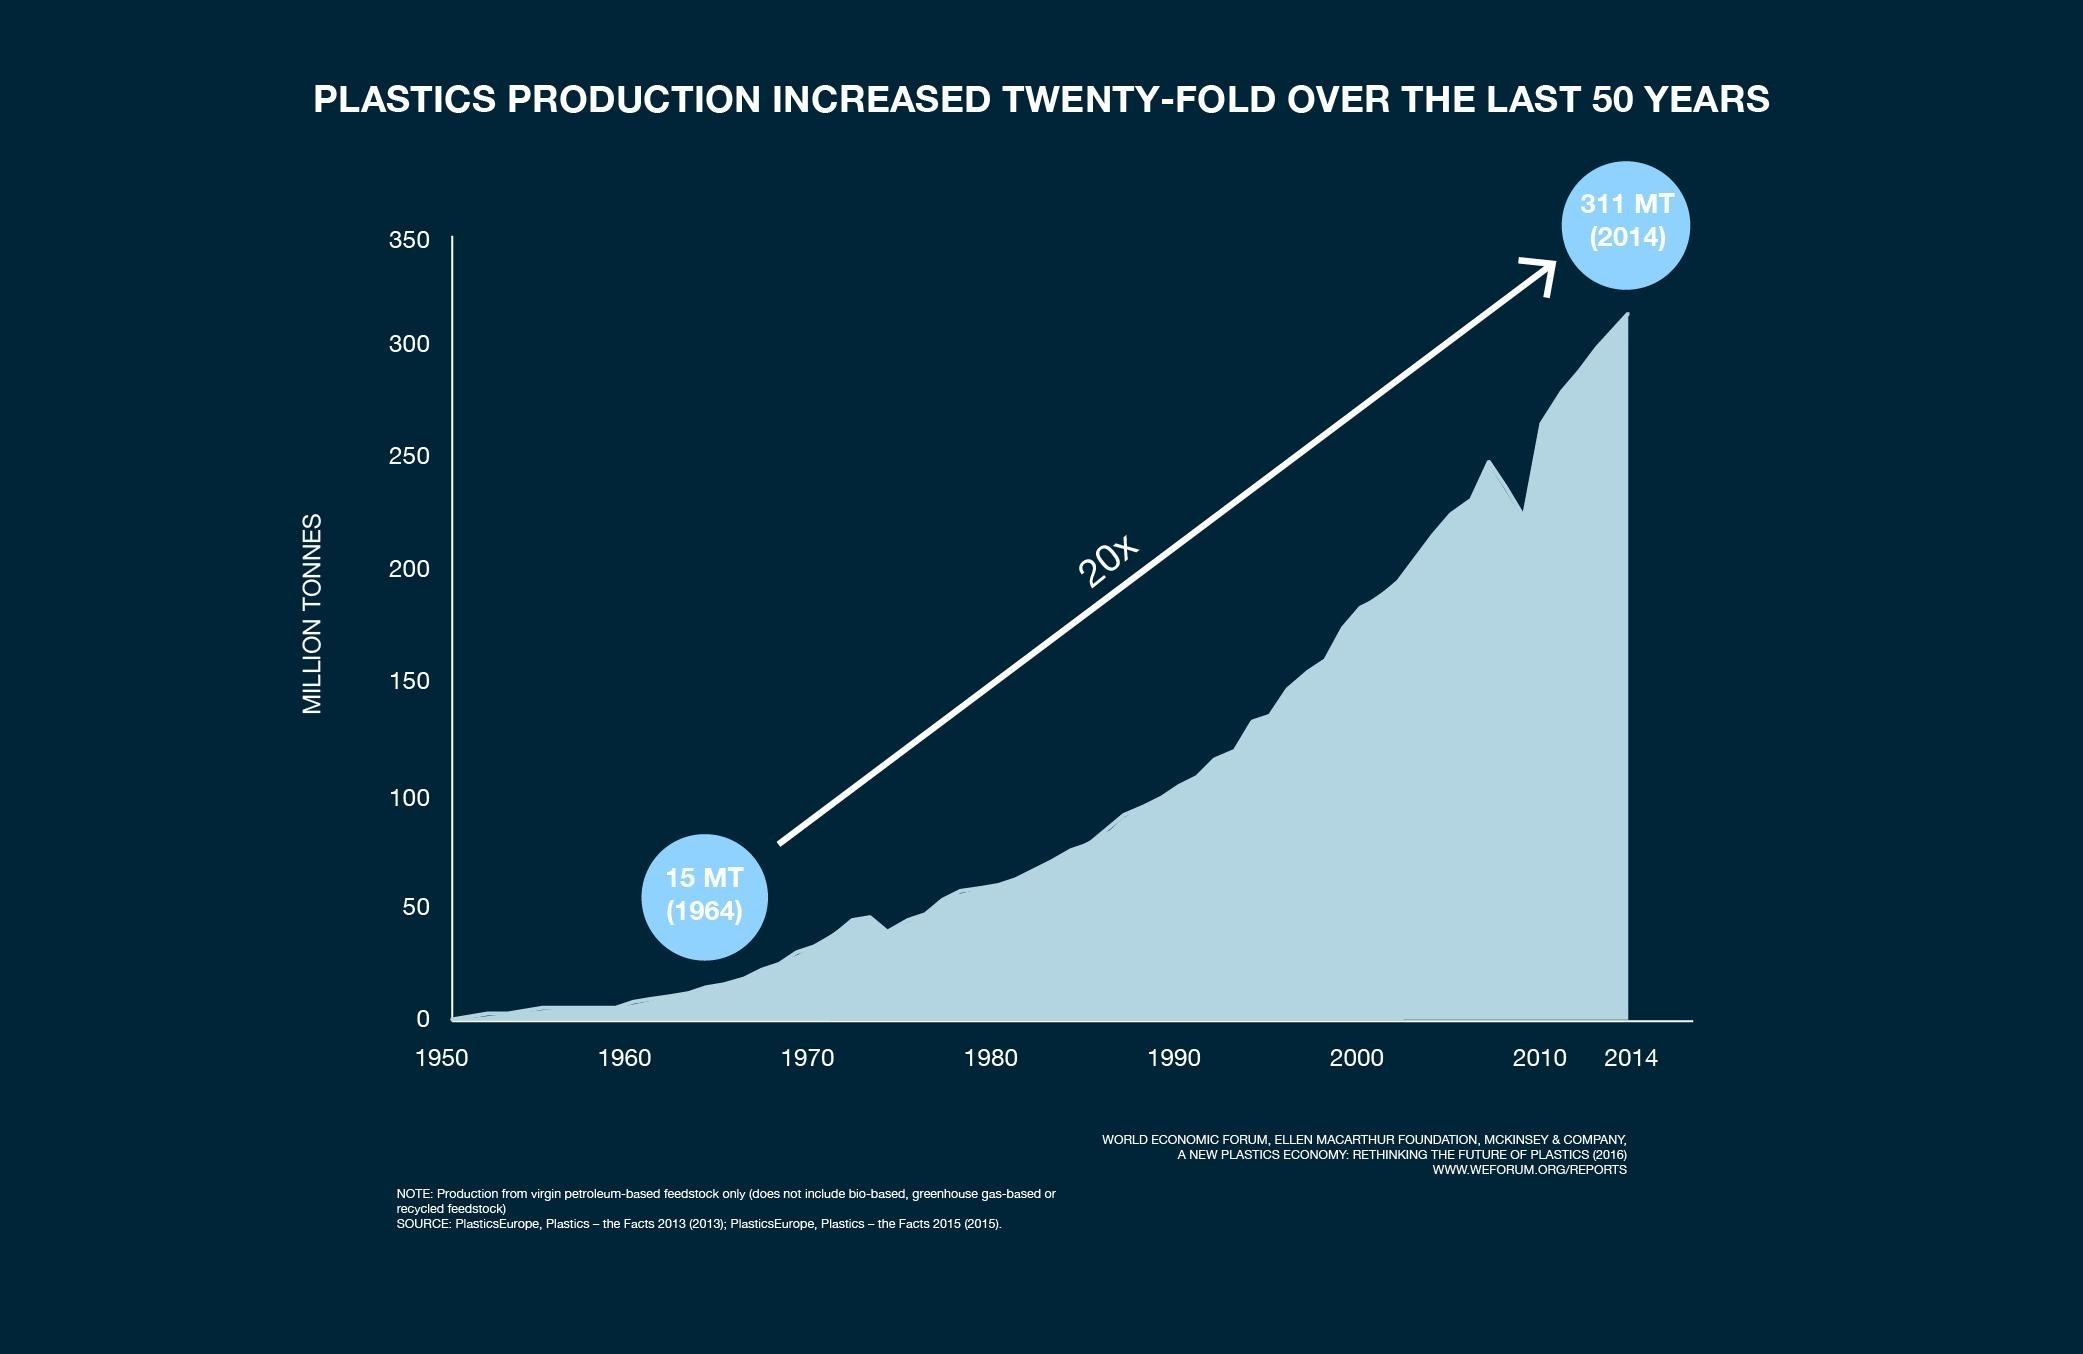
Plastic is the workhorse material of our modern consumer economy: since 1964, plastic production has increased 20 fold reaching 311 million metric tonnes (MMT) in 2014 - that’s the equivalent of 800 Empire State buildings. Between 1950 and 2015, more than 6,700 MMT of plastics were produced – the equivalent of more than 18,000 Empire State buildings. Since they can persist for hundreds of years, most of these plastics (except those that have been burned) still exist somewhere: as functional products, but also in landfills or as litter in the natural environment.
Growth in Global Plastic Production 1950-2014
It is rare to go a day without using some sort of plastic. The properties of plastics bring clear benefits to our economy; plastic packaging for example, accounting for 26% of all plastics used and the focus of the New Plastics Economy report, can help food stay fresh longer and can, because of its low weight, lead to fuel savings during transport compared to other types of packaging (glass, metal, wood etc). However, in general packaging is only used once, and often for a duration that can be measured in weeks or months, while the plastic packaging itself can continue to exist for centuries. It is well publicised that a lot of such packaging and other plastic products end up in the ocean; Australia has recently called a Senate enquiry into the state of plastic debris on its coast and the Great Pacific Garbage patch has entered our collective consciousness.
What happens to all of plastic flowing through our economy?
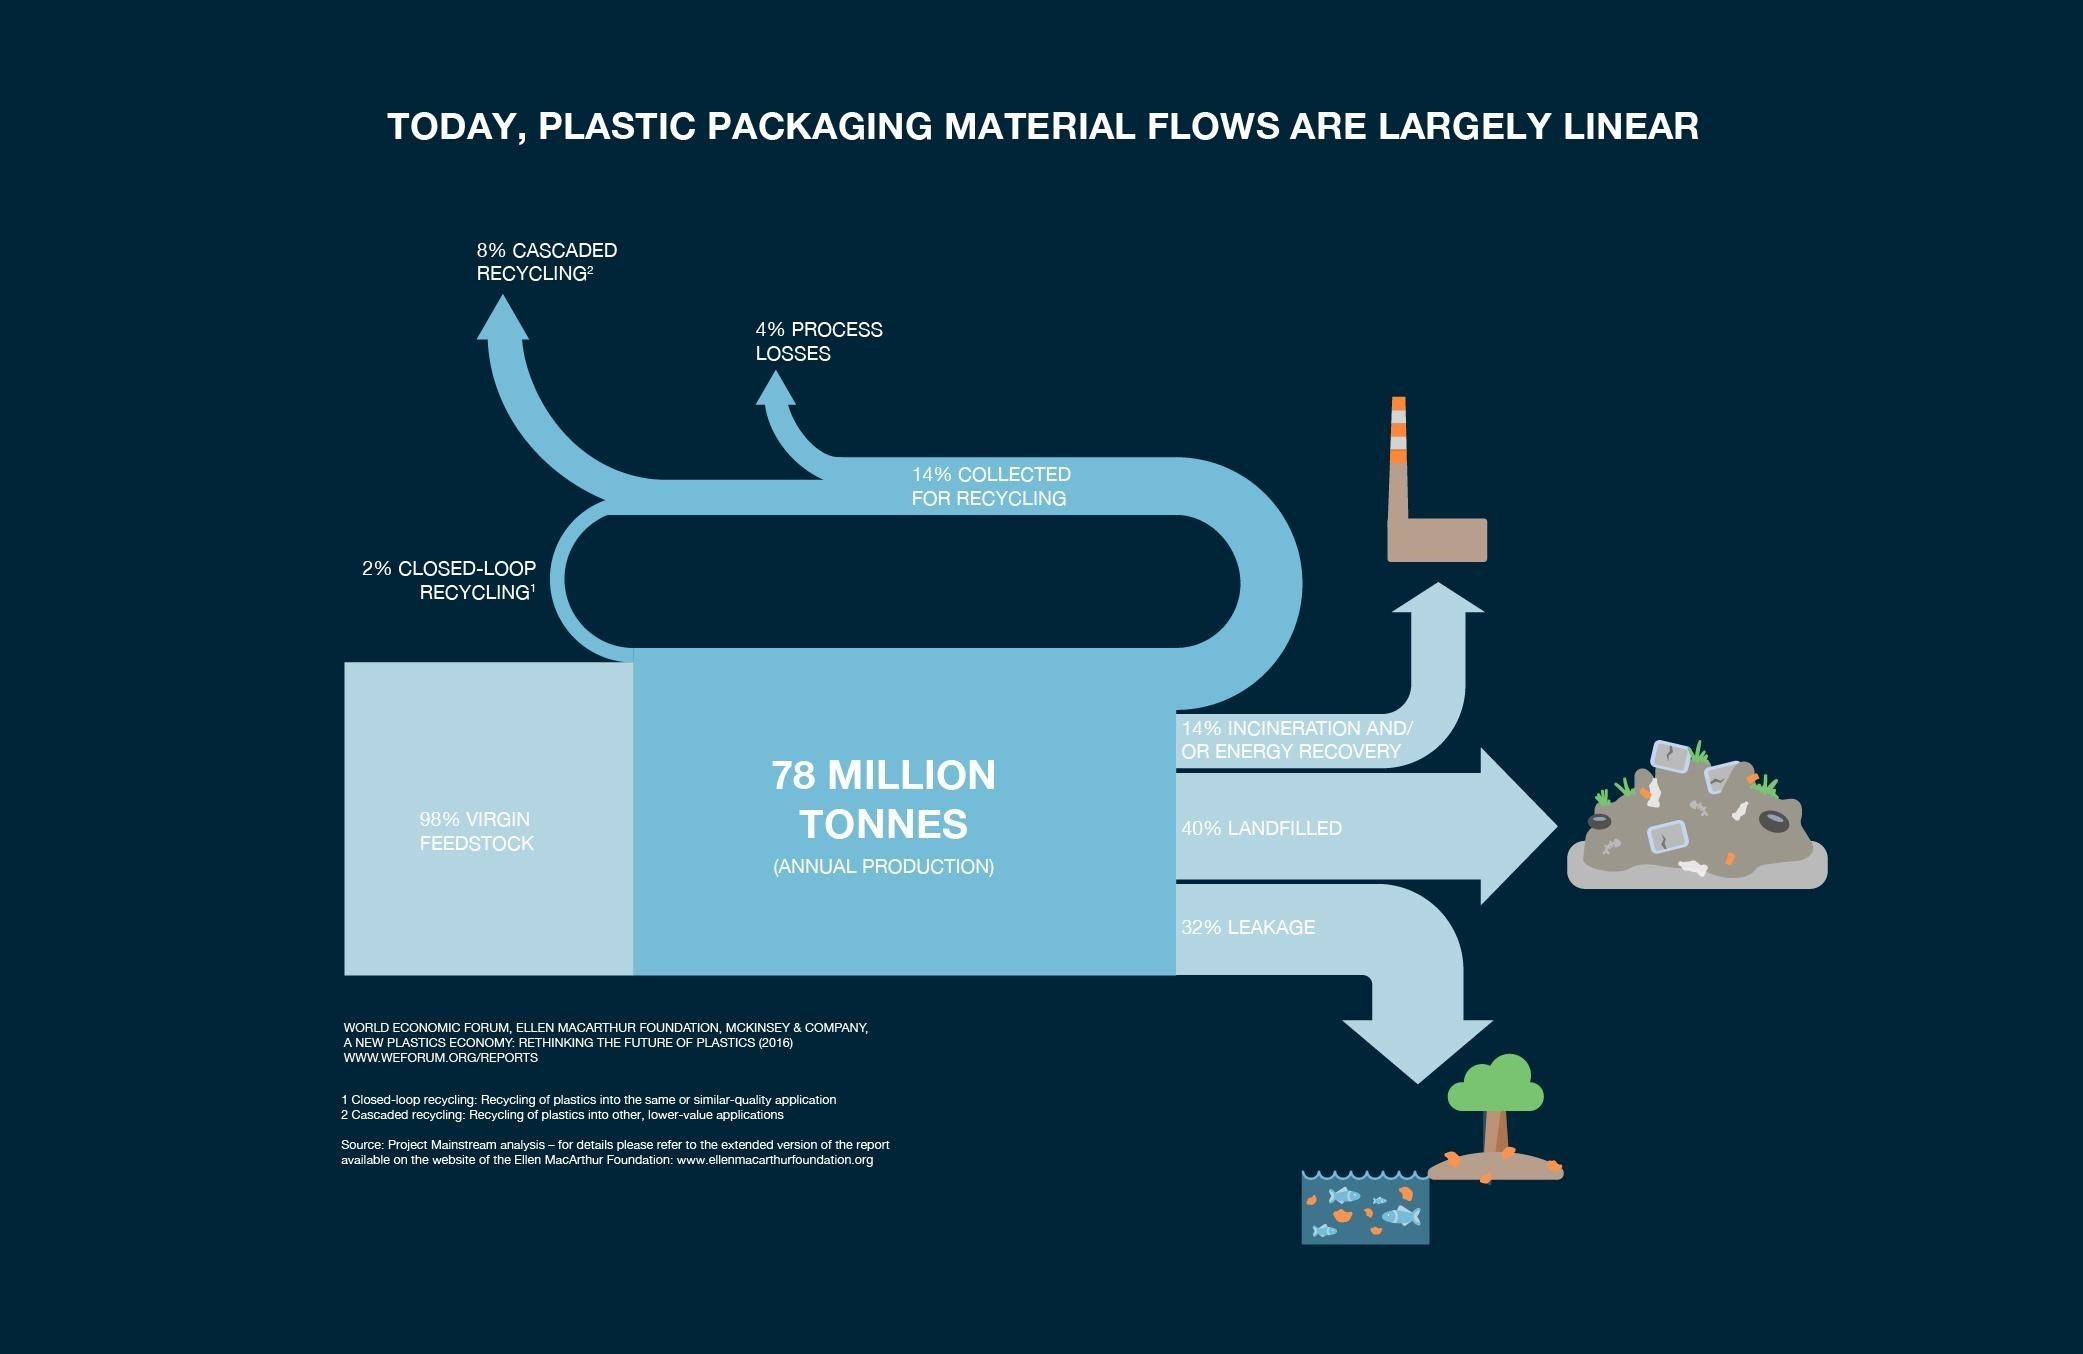
This question we assessed for plastic packaging specifically. Forty years after the introduction of the recycling symbol, only 14% of plastic packaging is collected for recycling. The remaining 86% of volume is buried, burned or dumped into the natural environment.
Global Flows of Plastic Packaging Materials in 2013
But how much plastic flows into the sea? This is a hard question to answer. It is impossible to count all the plastic in the ocean, as a lot of it dissolves to a micro scale (without disappearing!) or sinks. However, with the right model and data it is possible to get a good grasp of the volumes that are at stake. There are a few questions that need to be answered to get to that number, elaborated below.
How much plastic is mismanaged?
Mismanaged (or leaked) plastic waste is the total amount that is not properly landfilled, incinerated or recycled. For our numbers we used a 2015 study by Jambeck et al. In this study the team took World Bank data on waste generation for 145 countries, to estimate the total mass of plastic waste generated in 192 coastal countries. It then used more World Bank data on 81 coastal countries on how much of that plastic was mismanaged (for the remaining countries a fairly sophisticated model was applied based on income level and region). This resulted in an estimate of how much plastic evades being collected and flows into the natural environment, this could be clogging cities’ infrastructure, affecting deserts, forests, waterways and oceans, often the ultimate sink for plastics entering waterways in coastal regions.
How much of this mismanaged plastic ends up in the ocean?
There is not much country-by-country data that assesses this as it takes very detailed recording of statistics and a lot of effort tracking plastic, so at this point a certain amount of rigorous extrapolation is needed. The most comprehensive data on how much of the total mismanaged plastic makes its way into the sea covers the 71 municipalities which make up the catchment basin entering the Pacific at the San Francisco Bay. This data set shows that 61% of all littered or inadequately disposed plastics makes its way to the sea. The Jambeck study referenced this number and used a more conservative 25% as its middle scenario.
When applied across all coastal regions, this scenario estimates 8.0 MMT entered the ocean in 2010. Other, much higher, estimates exist. Jambeck’s high scenario, which uses a 40% rate of littered or inadequately disposed plastic makes its way to the sea (still well below the 61% observed in the San Francisco data), leads to an estimate of 12.7 MMT entering the ocean in 2010 (more than 50% higher than the 8.0 MMT). A 2015 report published by the environmental agency in Germany estimates global annual leakage of plastics into the oceans to be 18-30 MMT (two to almost four times as high as the 8.0 MMT). We however used the rather conservative estimate of 8.0 MMT for our calculations.
How much plastic is in the oceans today?
Estimating the total volume of plastics in the ocean today is again a complex task, which explains the limited amount of data available on the topic. However, data on annual plastics production and leakage into the ocean can lead to valuable insights. Based on global plastic production since 1950, the total amount of plastics in the ocean is estimated in the Ocean Conservancy’s 2015 report Stemming the Tide to be 150 MMT in 2015, which is also used in the The New Plastics Economy: Rethinking the future of plastics report. This again is a rather conservative estimate. When applying Jambeck’s estimate of plastics annually leaked into the oceans (8.0 MMT in 2010) as share of the global plastics production (about 3% of 266 MMT in 2010), the total volume of plastics produced globally since 1950 suggests over 200 MMT of plastics in the ocean having leaked in 2015, well above the 150 MMT estimated by the Ocean Conservancy. And that’s assuming the rate of leakage has been roughly constant – while it might have been larger as, for example, many collection systems were less advanced than they are today, and the disposal of plastics from ships into the sea was only banned in 1988.
How much plastics will be in the oceans by 2050?
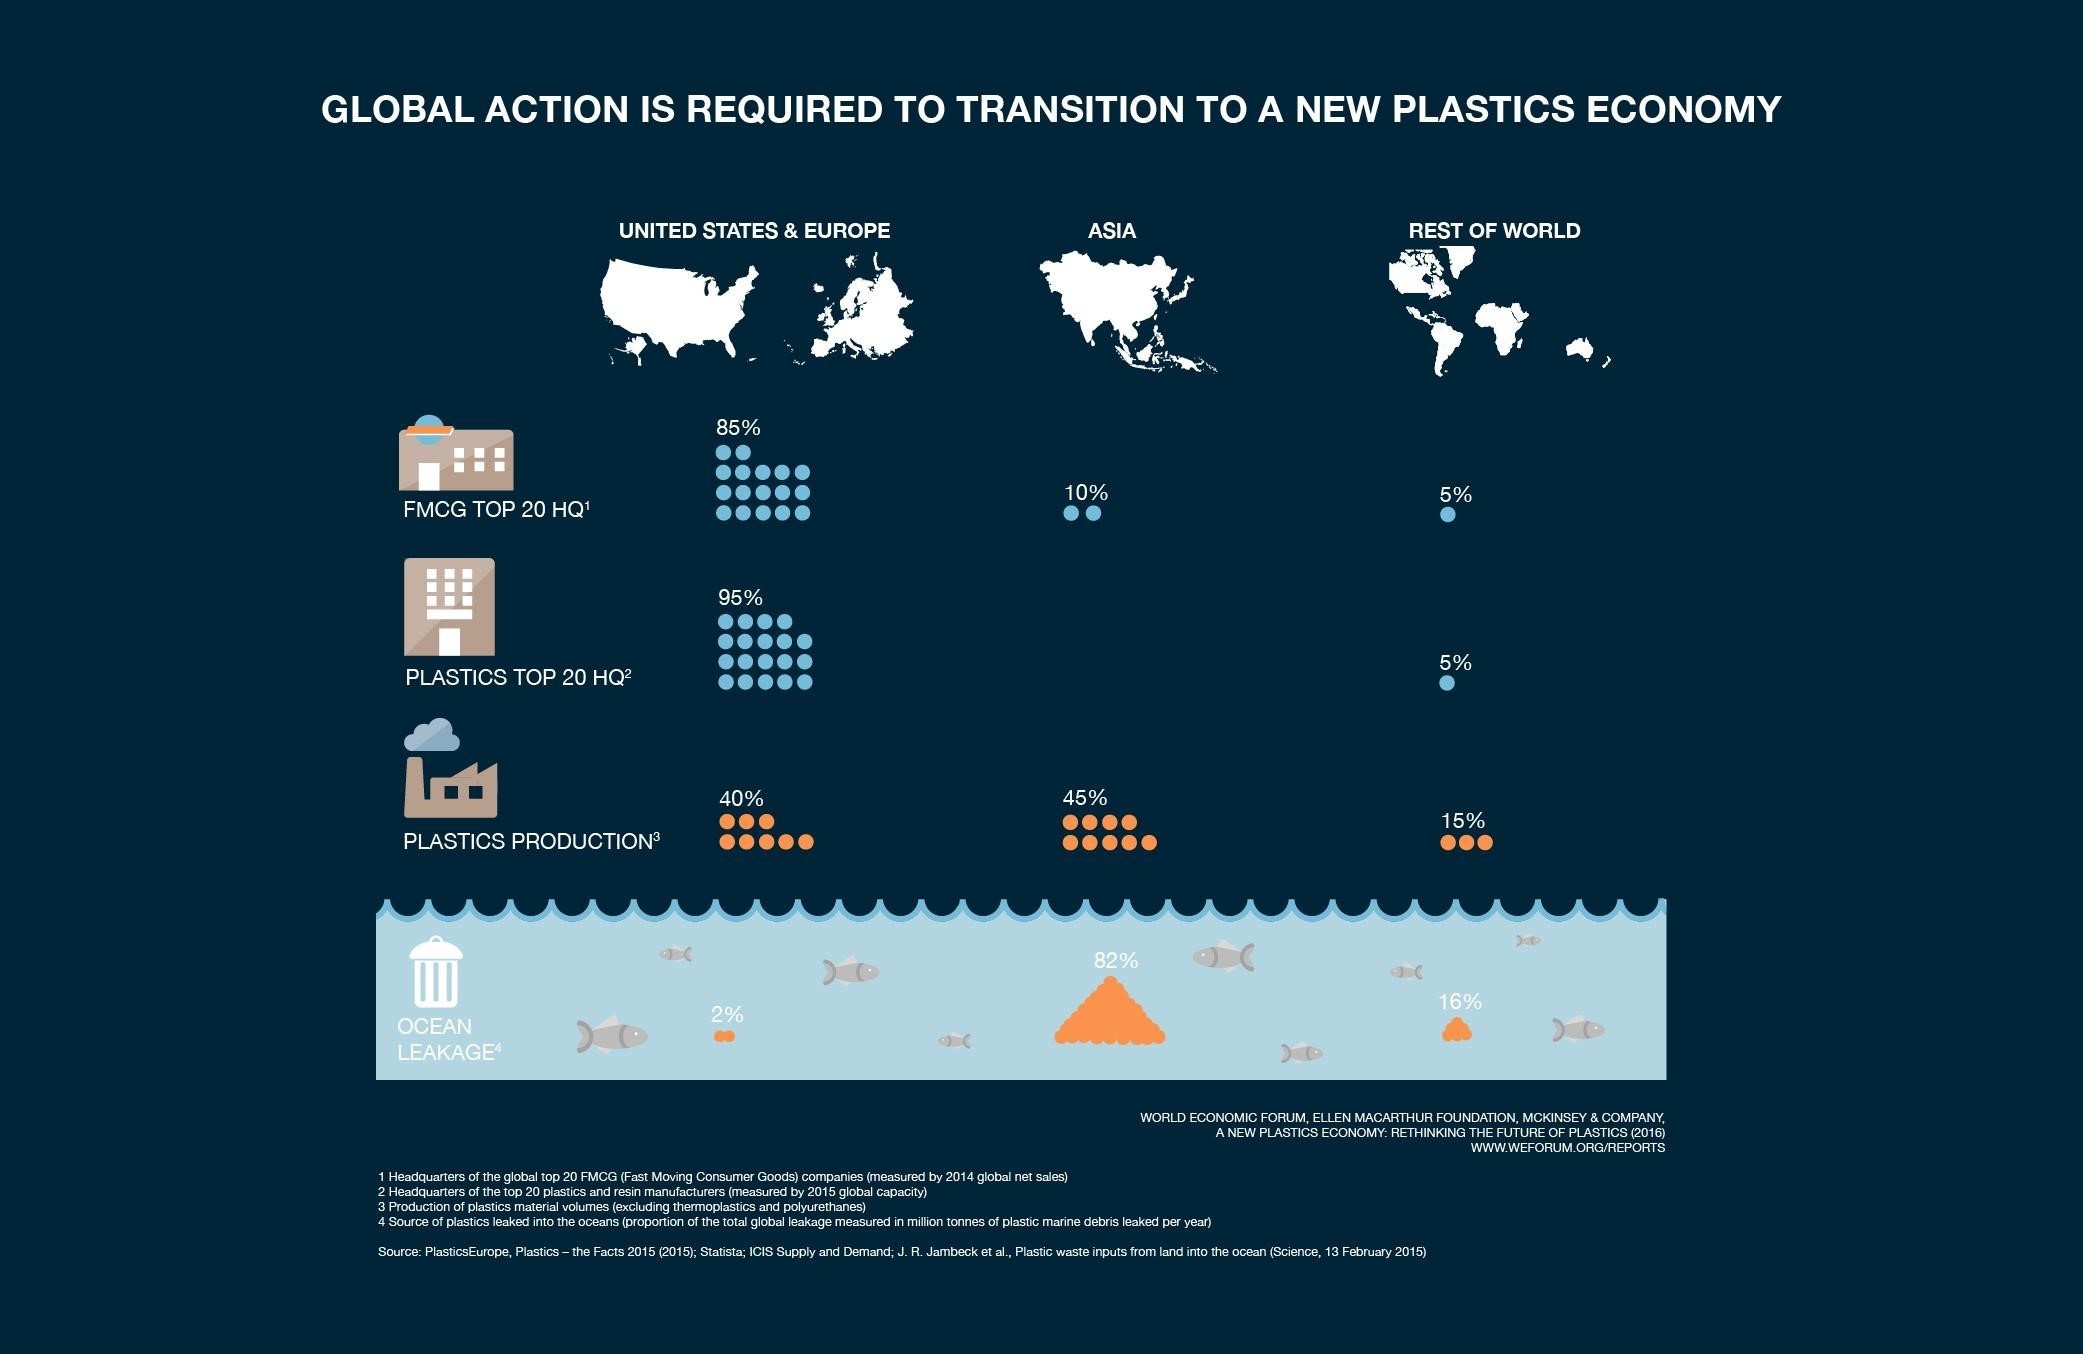
We conservatively rounded down Jambeck’s growth predictions to 5.0% per year until 2025. Between 2025 and 2050, we applied the expected global GDP growth rate of 3.5% per year. We consider this also a little conservative. First, historically global plastic production has grown faster than GDP. Second, emerging economies in Asia, where 80% of ocean leakage originates, are expected to see above average GDP and plastic consumption growth. Hence if no improvements to waste collection systems were made, leakage would grow faster than 3.5% per year. As such the estimate of 3.5% p.a. takes into account incremental improvements in waste management in high-leakage countries but no drastic, concerted action to stop the flow of plastics into the ocean – i.e. a business-as-usual scenario.
Distribution of Plastic Headquarters, Production and Leakage
Any forecast up to 2050 is inherently uncertain, but our study illustrates the order of magnitude of plastics entering the ocean if we do nothing to stop it. At this rate the cumulative amount of plastic in the ocean would be 850-950 million metric tonnes by 2050, as compared to 150 million metric tonnes today.

But how much plastic is 850-950 MMT?
That is more than 16,000 Titanics, or 2,000 Empire State Buildings or, the sum total of all the fish in the sea...
Now onto fish… How many fish are there in the sea?
Again, this is by its very nature a hard question to answer, one for which we turned to the Ocean Conservancy. In their most recent 2015 report they endorse a 2008 study that used satellite imagery to map plankton stocks, (as plankton is the base of the ocean food chain it is thought to be a good way of predicting the amount of biomass in the ocean), and estimated the total amount of fish in the sea to be around 812 MMT.
Global fish populations are currently subject to severe stress from multiple causes including overfishing. While – just as for the exact size of fish stocks – the precise extent of overfishing is by its very nature hard to determine, and different estimates exists, experts agree that it is a serious issue. According to a 2014 FAO report, 29% of assessed fish stocks are classified as overfished and a further 61% as fully exploited, with no ability to produce greater harvests. The WWF’s marine population index has fallen by half between 1970 and 2012, according to a 2015 report.
With further expected population growth and currently increasing global per capita fish consumption, overfishing as well as other issues remain real risks to fish populations going forward. The outcome is very uncertain and detailed predictions on evolutions of fish stocks by 2050 were out of the scope of our study, so we have crossed our fingers and hoped that fish stocks will remain intact in the next 35 years. Of course, were fish stocks to decline going forward, the threshold where the weight of plastics in the ocean would surpass that of fish could come even sooner than currently expected.
What is the New Plastics Economy and how can it help?
The New Plastics Economy report highlights multiple symptoms that all indicate one thing clearly: there is a systemic flaw in today’s plastics economy. We are losing economic value – 95% of the value of plastic packaging material value, worth $80-120 billion annually – and at the same time are degrading natural capital by leakage into the natural environment.
At its core, the New Plastics Economy report is about designing a blueprint for a system that captures plastic’s many benefits whilst addressing its drawbacks: using the plastics innovation engine to move the industry into a positive spiral of value capture, stronger economics and better environmental outcomes – in short, a New Plastics Economy.
The New Plastics economy would be one where plastics never become waste. This is underpinned by the principles of the circular economy, where nothing goes to waste and materials and products are kept at their highest possible value at all times. What would that look like?
The New Plastics Economy

How to get there?
Our report’s main recommendations to get to this New Plastics Economy include:
1. Collaboration: Bringing together all stakeholders across the global plastics value chain, including businesses, cities, and policy-makers.
2. Convergence and re-design of materials/formats and collection/sorting/reprocessing systems through development of a Global Plastics Protocol and coordination of large-scale pilots and demonstration projects.
3. ‘Moon shot’ innovations: Mobilizing large-scale, targeted “moon shot” innovations, such as, amongst others, new (bio-benign and self destructive) materials, improved formats, sorting technologies, and chemical and technical markers.
4. Close key knowledge gaps by providing insights and build an economic and scientific evidence base.
5. Engage policy-makers on a shared vision.
The world sat up and paid attention to this report when it was released at Davos. The rationale for action is clear, from the opportunity to capture material value to risk mitigation by decoupling a value chain from finite fossil fuels, and addressing externalities linked to climate change and leakage into the natural environment. Now let’s take it on, and start building the New Plastic Economy.
To find out more about plastics and the circular economy read the full report The New Plastics Economy.
To delve deeper into the statistics behind the report and for full references download the Background on Key Statistics document.
The New Plastics Economy has drawn on the expertise and contributions of a group of 40+ participant companies and cities along the global plastics value chain, as well as extensive consultation with academics, experts and NGOs. In total, more than 180 experts and over 200 publications were consulted during the report development.
Don't miss any update on this topic
Create a free account and access your personalized content collection with our latest publications and analyses.
License and Republishing
World Economic Forum articles may be republished in accordance with the Creative Commons Attribution-NonCommercial-NoDerivatives 4.0 International Public License, and in accordance with our Terms of Use.
The views expressed in this article are those of the author alone and not the World Economic Forum.
Related topics:
The Agenda Weekly
A weekly update of the most important issues driving the global agenda
You can unsubscribe at any time using the link in our emails. For more details, review our privacy policy.
More on Nature and BiodiversitySee all

Dan Lambe
April 24, 2024

Roman Vakulchuk
April 24, 2024

Charlotte Kaiser
April 23, 2024

Jennifer Holmgren
April 23, 2024

Agustin Rosello, Anali Bustos, Fernando Morales de Rueda, Jennifer Hong and Paula Sarigumba
April 23, 2024

Carlos Correa
April 22, 2024