This is what the UK tells us about the impact of minimum wage policies

What effect do minimum wage policies have on the workforce? Image: REUTERS/Russell Cheyne


Get involved with our crowdsourced digital platform to deliver impact at scale
Stay up to date:
Economic Progress
There is renewed interest from governments around the world in minimum wage policies. These has been more common in places where real wages have stagnated, because a minimum wage is a policy lever to generate a wage increase at the bottom of the wage distribution. For example, Germany introduced a national minimum wage in 2015 (Caliendo et al. forthcoming), and Seattle and Los Angeles passed measures to progressively increase the minimum wage to $15.00 per hour by 2018 and 2020, respectively (Jardim et al. 2017, Reich et al. 2017).
In a recent study (Giupponi and Machin 2018), we analyse the consequences of the introduction of the National Living Wage in the UK. Following the general election in May 2015, the Conservative Party formed a government. It called an emergency budget on 8 July 2015 in which it unexpectedly announced the introduction of the National Living Wage. This raised the minimum wage rate for workers aged 25 and over from £6.70 to £7.20, starting on 1 April 2016, while leaving the minimum wage for younger workers at the level of the existing National Minimum Wage.
The National Living Wage changed the structure of minimum wages in the UK. There were now five wage rates instead of four, and an altered age profile. Now there is the National Living Wage for workers aged 25 and over and the National Minimum Wage for workers between 21 and 24, plus a youth development rate for those between 18 and 20, a young worker rate between 16 and 17 years, and a minimum wage for apprentices.
We are interested in how English care homes adjusted to the National Living Wage, and whether it had consequences for younger workers who were not directly affected by it. The care homes sector employs a large number of low-paid workers, and so is highly vulnerable to changes in minimum wages. Many of these workers are aged 25 and over, and so it is well-suited to analysing the introduction of the National Living Wage. The sector is also labour intensive, and the fees of residents are regulated and paid by local authorities.1 So a minimum wage change is likely to have a large effect on total costs, and potentially have an impact workers and firms that are more affected by the change.
The impact of the National Living Wage on wages
We analyse matched worker-firm level data in English care homes, and find that the National Living Wage strongly affected the wages of care workers. The black circles in Figure 1 show the regression coefficients of quarter-on-quarter hourly wage growth on the fraction of workers who were paid less than £7.20 in March 2016. The graph provides compelling evidence of substantially higher wage growth in firms for which a larger proportion of workers were paid below the National Living Wage a month before its introduction. In other words, the National Living Wage generated important wage growth at the bottom of the hourly wage distribution.
Figure 1 Relationship between the proportion of workers paid below the National Living Wage in March 2016 and quarterly wage growth
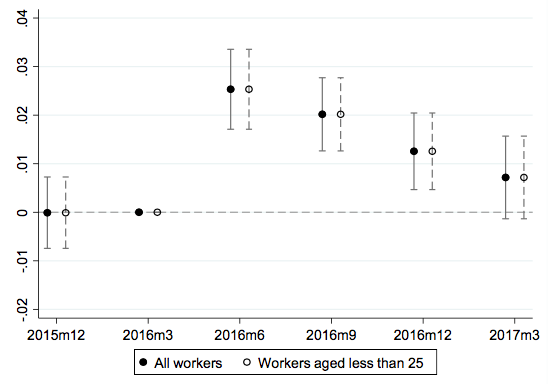
Note: The graph reports the regression coefficients of a regression of quarter-on-quarter wage growth on the fraction of workers paid less than the National Living Wage in March 2016 (black circles), and of a regression of quarter-on-quarter wage growth for workers aged less than 25 on the fraction of workers aged 25 and over paid less than the National Living Wage in March 2016 (hollow circles). Capped vertical bars represent 95% confidence intervals based on robust standard errors. Estimates are relative to March 2016. The regressions include firm-level controls for proportion female, proportion with nursing qualification, proportion of care assistants, average age (all workers), occupancy rate and regional dummies.
In spite of this wage increase, we find little evidence of adverse effects on employment and hours worked. Figure 2 shows the coefficients of a regression of quarter-on-quarter employment growth on the proportion of workers paid below the National Living Wage as of March 2016. None of the coefficients is statistically significantly different from zero. The wage-cost shock of the introduction of the National Living Wage did not cause lower employment growth in the firms most affected by it.
Figure 2 Relationship between the proportion of workers paid below the National Living Wage in March 2016 and quarterly employment growth
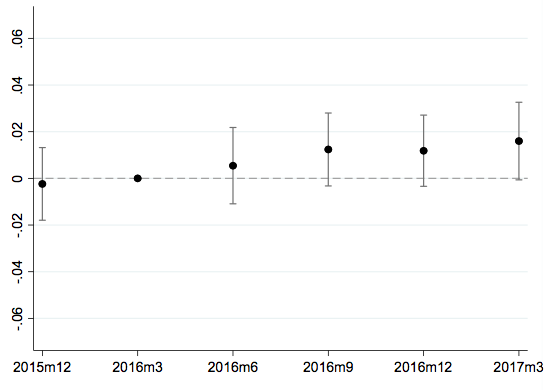
Note: The graph reports the regression coefficients of a regression of quarter-on-quarter employment growth on the fraction of workers paid less than the NLW in March 2016. Capped vertical bars represent 95% confidence intervals based on robust standard errors. Estimates are relative to March 2016. The regressions include firm-level controls for proportion female, proportion with nursing qualification, proportion of care assistants, average age (all workers), occupancy rate and regional dummies.
The impact of the National Living Wage on quality of care
Local authority regulations allow limited changes for resident fees, so it is unlikely that care homes responded to the wage shock by increasing prices. It is plausible that homes suffered a hit to their profits, but we do not find evidence that the National Living Wage increased the probability of firm closure. Any profit hit has therefore not yet been large enough to drive firms out of business.
The margin of adjustment used to offset this wage cost shock appears to be the quality of care services. The Care Quality Commission (CQC), the independent regulator of health and adult social care in England, is responsible for periodically inspecting and rating adult social care providers. The reports from its inspections give us information on the quality of care.
Homes are rated by the CQC on whether the service is safe, effective, caring, responsive to people’s needs and well-led. Our empirical results uncover a worsening of care services along all five dimensions in care homes where the National Living Wage bit harder. There is a growing need for care services in our aging society, and so we should be concerned about the ability of the care home industry to meet fundamental standards of quality and safety in the longer run at current levels of funding.
Spillover effects on wages of younger workers
The National Living Wage specifically increased the minimum wage for workers aged 25 and over but left the rate for workers aged between 21 and 24 at £6.70. Interestingly, we find strong evidence that the National Living Wage generated positive spillover effects on the wages of these younger workers. Looking back at Figure 1, the hollow circles show the estimated coefficients from a statistical regression of quarter-on-quarter wage growth for workers aged less than 25 on the proportion of older workers paid less than the National Living Wage in March 2016. The evolution of the coefficients for younger workers mirrors the one we found for the entire sample of care assistants over all age groups.
Firms might be induced to raise wages of younger workers because it is fair, or simpler for administrators. Yet, if youth productivity is lower than the uprated wage, the firms might at the same time try to reduce the share of hours worked by younger workers, or the proportion of young workers that they employed. We also test whether positive wage spillovers are associated with negative employment consequences for younger workers, and find no evidence of negative spillovers.
Perhaps positive spillovers on younger workers’ occur because either workers or firms care about pay fairness, and like workers doing the same job to receive the same wage whatever their ages. If workers’ preferences for fairness are entirely responsible for the emergence of wage spillovers, those spillovers should be stronger for employees working in teams or with direct sight of their colleagues while working.
We replicate our analysis in the domiciliary care sector to test whether spillover effects are driven by workers’ as opposed to employers’ preferences. Domiciliary care is a social care service provided to people who live in their own houses who require assistance with personal care routines or other activities. Domiciliary care assistants typically work individually and drive their own car to visit the homes of their customers. They are often contracted on flexible working hours because their work tends to be organised into short and fragmented home visits.
Therefore, domiciliary carers have limited face-to-face interactions with co-workers. They are unlikely to be fully aware of the working conditions of their colleagues. If wage spillovers were entirely due to workers’ preferences, we would expect them to have been smaller for domiciliary carers than care assistants. Our findings indicate that domiciliary care workers experienced wage spillovers similar in magnitude to those in the care home industry. It seems that team dynamics and workers’ preferences for fairness did not act as key drivers of minimum wage spillovers.
Two additional theories could explain downward wage spillovers. Employers may prefer pay fairness, or desire administrative simplicity to minimise the costs of managing a diverse wage structure. We cannot formally test which of these two theories is more important, but information we gathered from care homes seems to support the 'fairness hypothesis'.
We surveyed care homes owners and managers both before and after the National Living Wage was introduced and asked for their views on its level. Before it was introduced, 43% of respondents believed that the level of the National Living Wage was about right, 15% thought it too low, 38% too high, and 4% not having an opinion. After April 2016, respondents appeared to be much more favourable, with 53% considering it about right, 20% too low, 24% too high, with 3% not having an opinion.
Moreover, while it is not uncommon for respondents to state that it is fair for a worker to earn a living wage, none mention administrative simplicity as a reason for aligning wages of younger and older workers. Therefore, employer preferences are the most plausible explanation for the wage spillovers.
The main impact of the changed minimum wage structure has on the wages of both directly affected older workers and indirectly affected younger workers. We find no evidence of employment adjustment, but a worrying deterioration in the quality of care.
Don't miss any update on this topic
Create a free account and access your personalized content collection with our latest publications and analyses.
License and Republishing
World Economic Forum articles may be republished in accordance with the Creative Commons Attribution-NonCommercial-NoDerivatives 4.0 International Public License, and in accordance with our Terms of Use.
The views expressed in this article are those of the author alone and not the World Economic Forum.
Related topics:
The Agenda Weekly
A weekly update of the most important issues driving the global agenda
You can unsubscribe at any time using the link in our emails. For more details, review our privacy policy.
More on Economic ProgressSee all

Joe Myers
April 12, 2024

Joe Myers
April 5, 2024

Pooja Chhabria
March 28, 2024

Kate Whiting
March 28, 2024

Joe Myers
March 28, 2024

Andrea Willige
March 27, 2024