What will global GDP look like in 2030?

Growth gap ... rich nations will expand fast, while poor ones lag behind Image: REUTERS/Carlos Barria

Get involved with our crowdsourced digital platform to deliver impact at scale
Stay up to date:
Economic Progress
Global GDP is expected to increase by 2030, but the gap between the richest and poorest economies is set to stay almost the same.
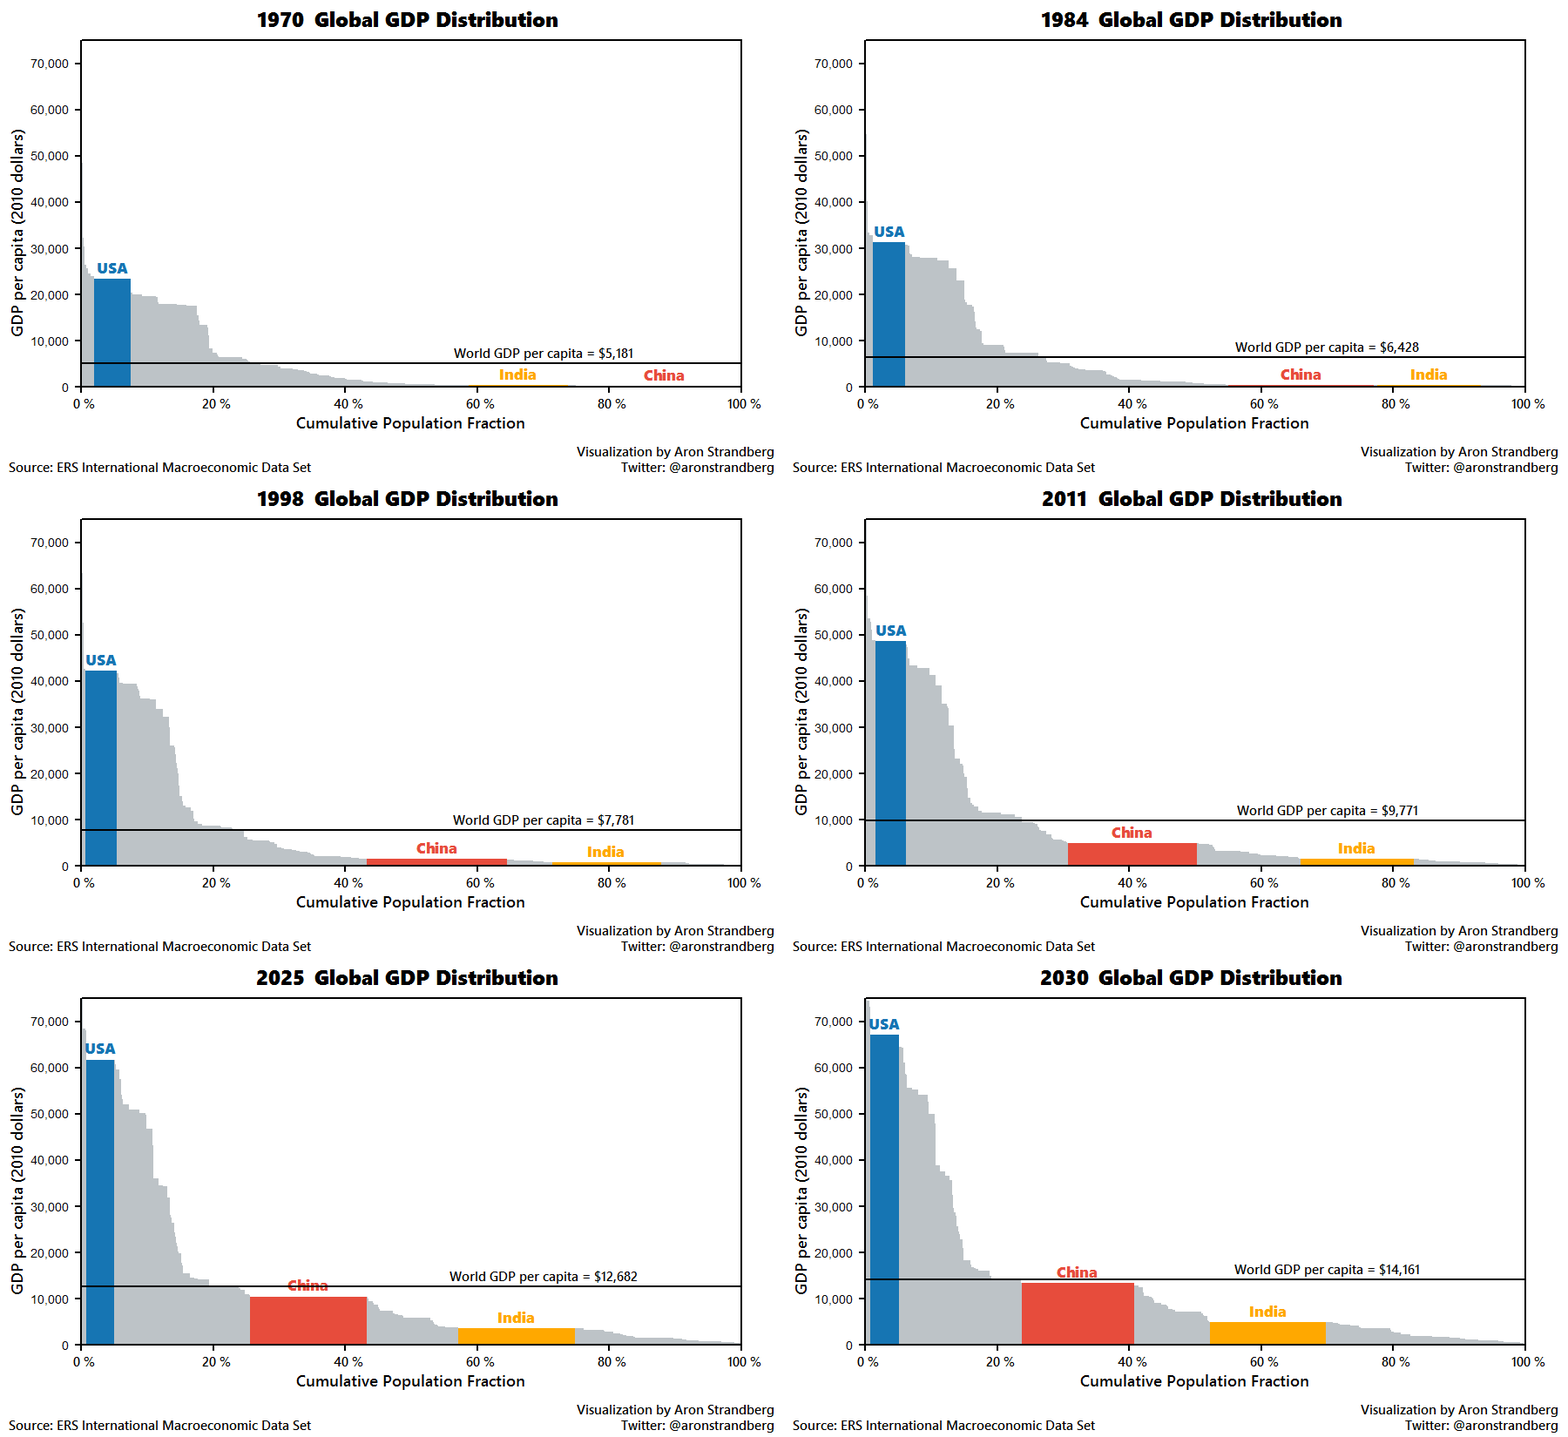
This visualization by Aron Strandberg uses data from the ERS International Macroeconomic Data Set to show the change in global GDP distribution between 1970 and 2030 looking at the United States, China and India.

The comparison between 1970 and 2016 shows that global growth has almost doubled, with average world GDP, per capita, growing from around $5,000 to over $10,000. The projected growth for 2030 sees world per capita GDP growing to around $14,000.
The United States continues to grow, consistently well above the global average, maintaining its status as one of the world’s largest economies.
What the visualization also shows is the rapid development of China’s economy, starting behind India in the 1970s, overtaking in the mid 1980s and thereafter consistently growing into a more dominant global economy.
The data predicts China will continue growing, but by 2030 it will still be below the world average. India’s growth has been much slower than China’s, meanwhile, but is predicted to increase over the next 14 years.
This visualization highlights the overall growth of global economies, with the poorer ones continuing to lag behind. Africa, for example, sees steady but considerably slower growth than the rest of the world, with much lower levels of per capita GDP across the continent.

Source: humanprogress.org
In 2015 in Africa, the average GDP per person was $20,000 less than the global average, at around $4,000. The ERS International Macroeconomic Data Set shows that the average GDP per person in the United States for 2015 was more than $50,000.
Don't miss any update on this topic
Create a free account and access your personalized content collection with our latest publications and analyses.
License and Republishing
World Economic Forum articles may be republished in accordance with the Creative Commons Attribution-NonCommercial-NoDerivatives 4.0 International Public License, and in accordance with our Terms of Use.
The views expressed in this article are those of the author alone and not the World Economic Forum.
Related topics:
The Agenda Weekly
A weekly update of the most important issues driving the global agenda
You can unsubscribe at any time using the link in our emails. For more details, review our privacy policy.
More on Economic ProgressSee all
Joe Myers
April 19, 2024
Joe Myers
April 12, 2024
Joe Myers
April 5, 2024
Pooja Chhabria
March 28, 2024
Kate Whiting
March 28, 2024
Joe Myers
March 28, 2024


